
Figure 3.
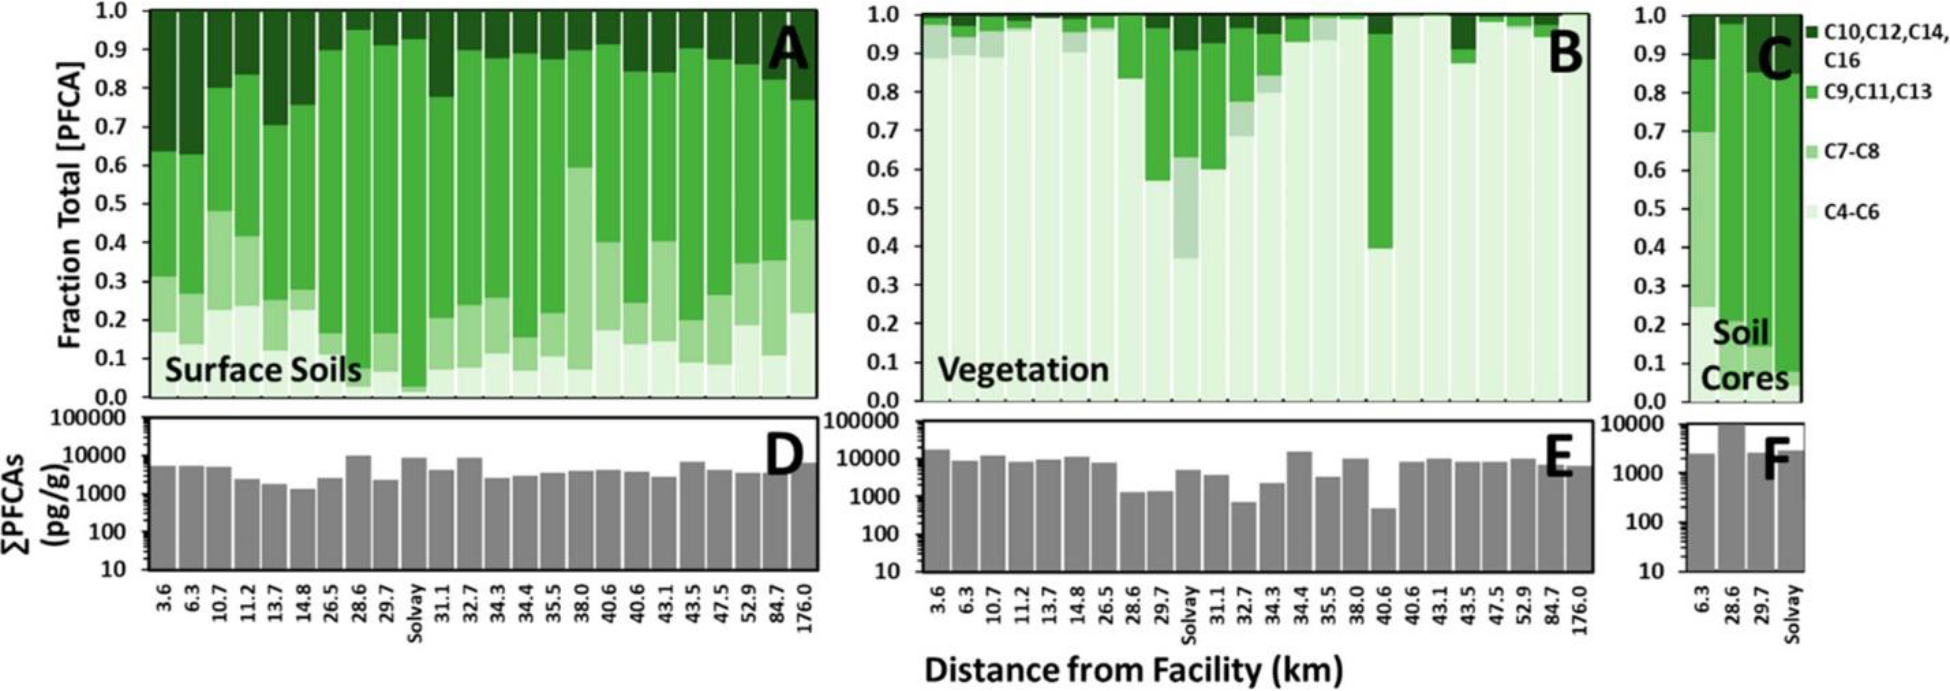
Homologue distribution (A–C) and concentration (D–F) of PFCAs in surface soils (A and D), vegetation (B and E), and subsoils (C and F) normalized by dry-sample mass. Samples ordered by distance from Chemours. The sample labeled Solvay is Sample 8, the closest sample to the Solvay facility. Relative concentrations in vegetation and surface soils for all 24 samples are 63% vegetation and 37% surface soils. Relative concentration strengths in vegetation, surface soils, and deep soils for the four cored samples is 27% vegetation, 44% surface soil, and 29% deep soils. Note the relatively large contribution of long even-numbered PFCAs (C10 + C12 + C14 + C16) in surface soil closest to Chemours, the relatively large contribution of long odd-numbered PFCAs (C9 + C11 + C13) in surface soils and vegetation near Solvay, and the contrast in deep soils of intermediately sized PFCAs with predominantly lower molecular weight congeners for Cl-PFPECAs. See the text for discussion.