
Figure 5:
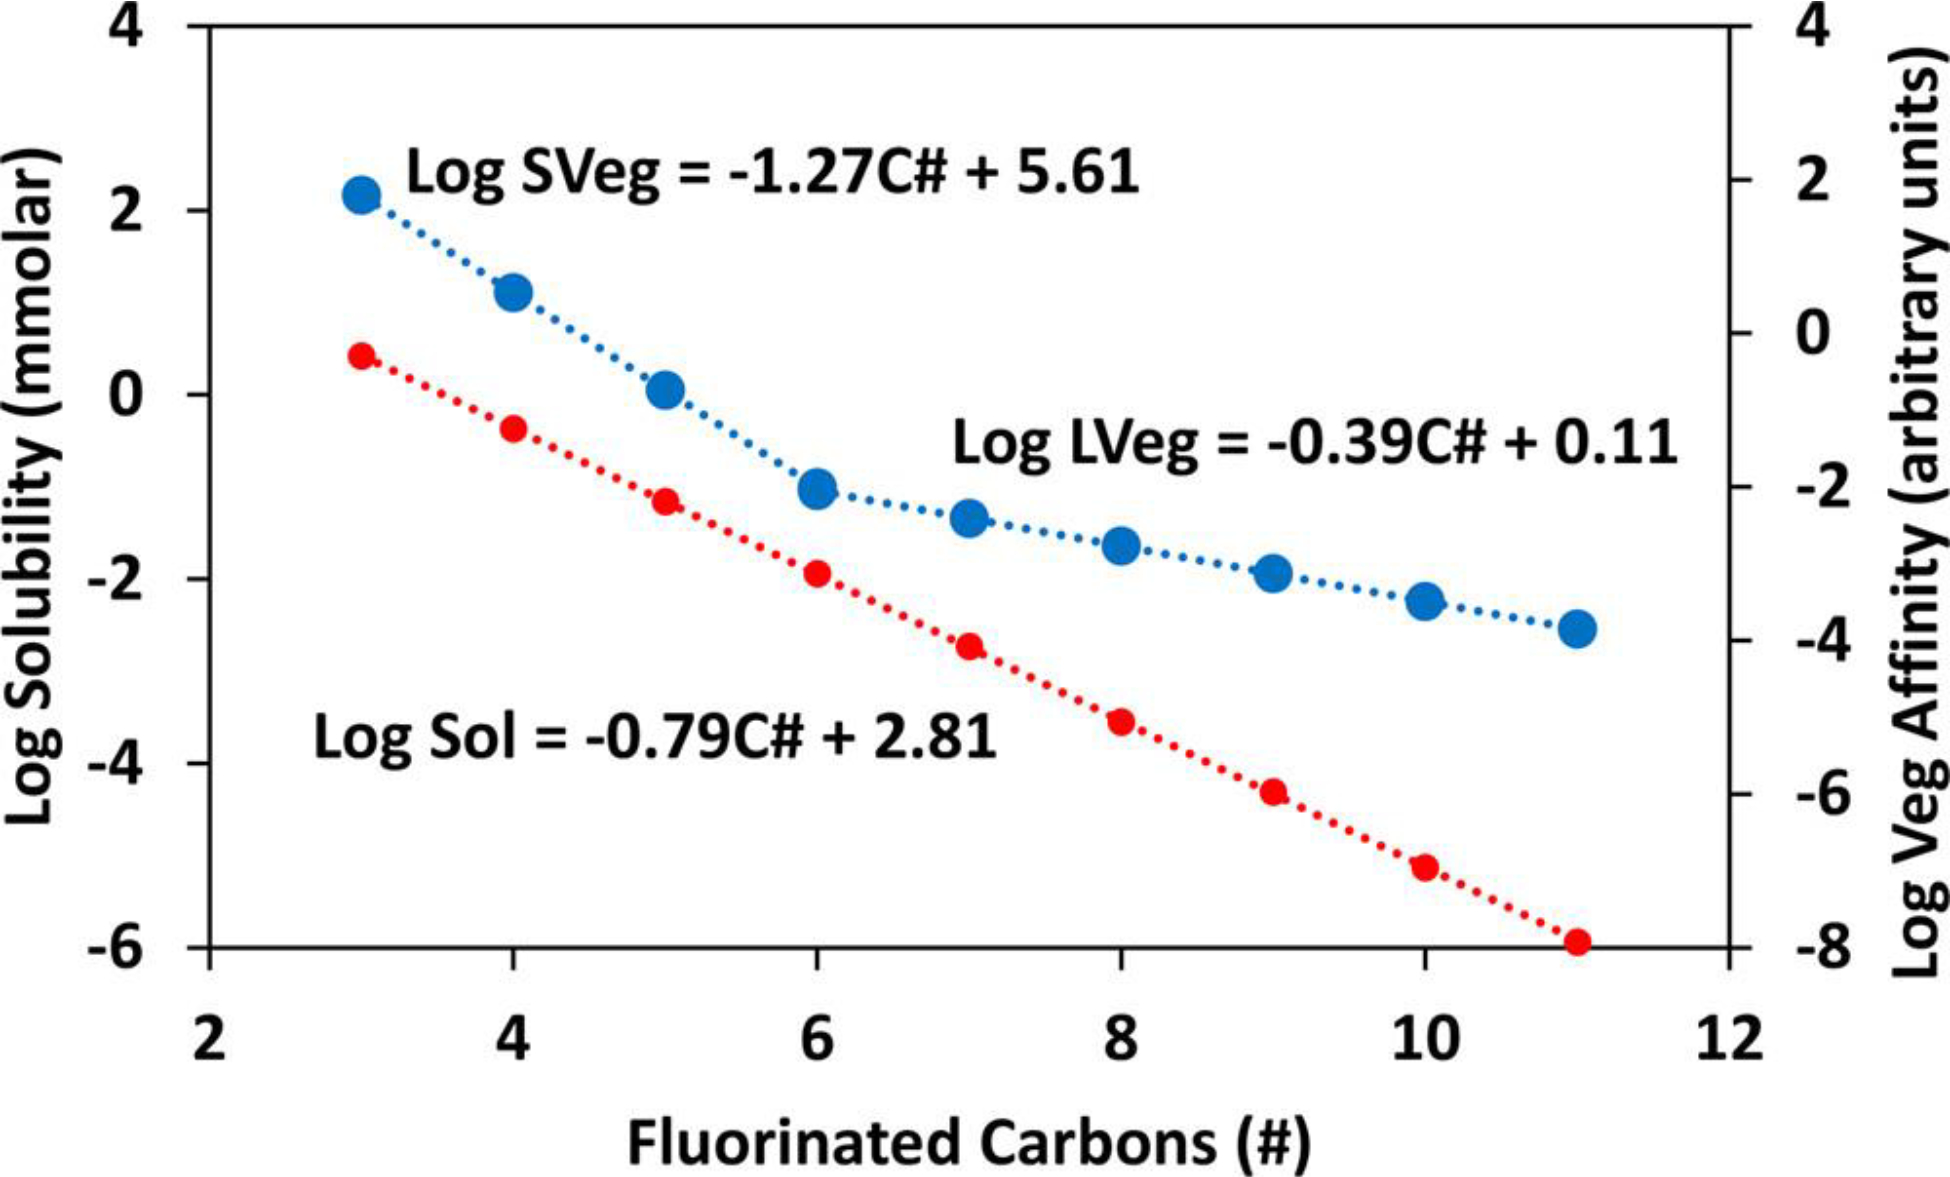
Log solubility (red; primary y axis) and log relative vegetative affinity (blue; secondary y axis) vs number of fluorinated carbons (CF2) for PFCAs. Solubility (red) was modeled by Wang et al. (55) Relative vegetative affinity for homologues is estimated by the regressions depicted in Figure 4C as explained in the text. According to this approach, the incremental increase in affinity of vegetation for PFCAs is greater for short chains (SVeg; ) than long chains (LVeg; ). For example, the relative affinity of perfluorobutane carboxylate () is >700-fold higher than suggested by the long-chain (LVeg) trend. Also noteworthy, the relative vegetative affinity slope is less than that of bulk-water solubility for long-chain PFCAs but greater than the solubility slope for short-chain PFCAs.