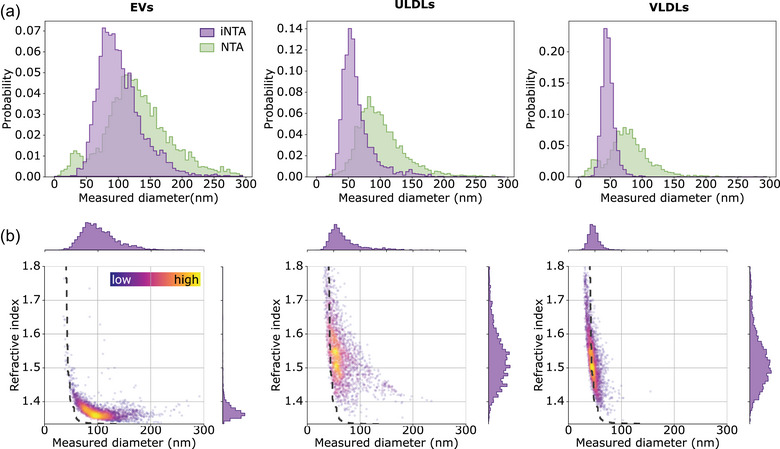
FIGURE 1.

iNTA is more sensitive than NTA for smaller‐sized EVs and LPs, and enables refractive index measurements. (a) EV, ULDL and VLDL size distributions as measured by NTA (green) and iNTA (purple). (b) Size‐RI plots for EV, ULDL and VLDL measured by iNTA. Colour bar indicates the local density of points. In the region to the right of the dashed gray line, the IQR of RI based on simulations is smaller than 0.05.
