FIGURE 2.

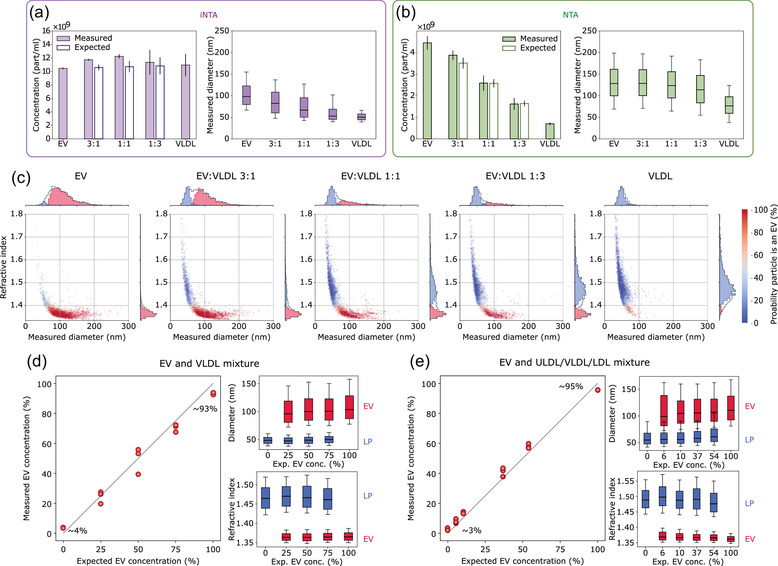
iNTA but not NTA can discriminate EVs and LPs in artificial mixtures. (a) iNTA and (b) NTA analysis of different EV‐VLDL mixtures showing mean particle concentration (filled bars indicate the measured concentration while unfilled bars indicate the expected concentration based on measurements of pure EV and VLDL samples, standard deviation is shown) and median size (box boundaries are 25–75 percentile, horizontal line is median, whiskers indicate 10–90 percentile) (n = 3). Concentration for iNTA measurements is calculated by multiplying the number of trajectories measured in 10 min by a calibration factor determined previously (see Methods). (c) Representative size‐RI plots for the different EV‐VLDL mixtures, labelled using a random forest classifier. Colour indicates probability for the particle to be an EV. Only particles with greater than 80% probability of being an EV or less than 20% probability of being an LP are included in the 1D histograms. (d) Left: Measured relative EV concentration plotted versus expected relative EV concentration. The measured concentration is calculated as CEV/(CEV+CVLDL), where C denotes particle concentration determined from plots in (c) using the random forest classifier. The numbers indicate the measured relative EV concentration when no EVs were expected (∼4%) and when only EVs were expected (∼93%). Right: The extracted diameter and refractive index of EVs (red) and lipoproteins (blue). RI was calculated by considering only particles with an IQRS < 0.05. (e) Same as (d), but using a mixture of EVs with ULDLs, VLDLs and LDLs. Expected EV concentration was determined based on iNTA measurements of the pure EV sample and of the LP mixture.
