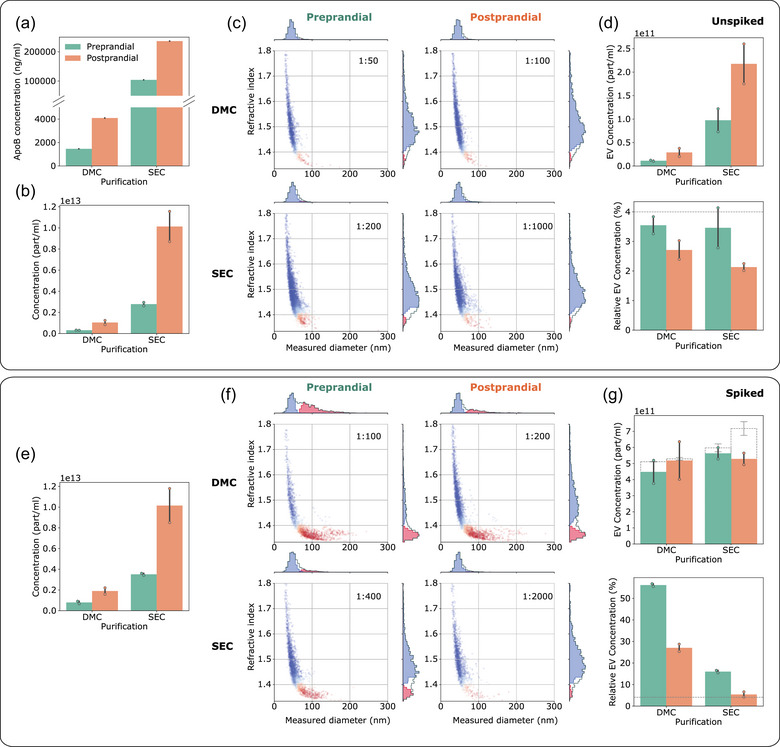
FIGURE 3.

iNTA can accurately measure EVs in plasma‐derived samples with variable LP background. (a) ApoB ELISA measurements in DMC‐ and SEC‐processed samples (left and right), pre‐ and post‐prandial (green and orange). (b) Total particle concentrations measured by iNTA. (c) Representative size‐RI plots after machine learning processing (particles classified as EVs are indicated in red and LPs in blue). The numbers in the upper right corner indicate sample dilution factor by PBS prior to iNTA measurements. (d) EV concentration (top) and relative EV concentration (bottom) as determined by iNTA. Dashed line indicates the error threshold for EV classification (4%). (e)–(g) Same as (b)–(d) but for samples spiked with 5E11/mL SKMEL37 EVs. In (g) the dashed bars show the expected EV concentration based on values in (d). Mean and standard deviation are shown for all bar graphs (n = 2).
