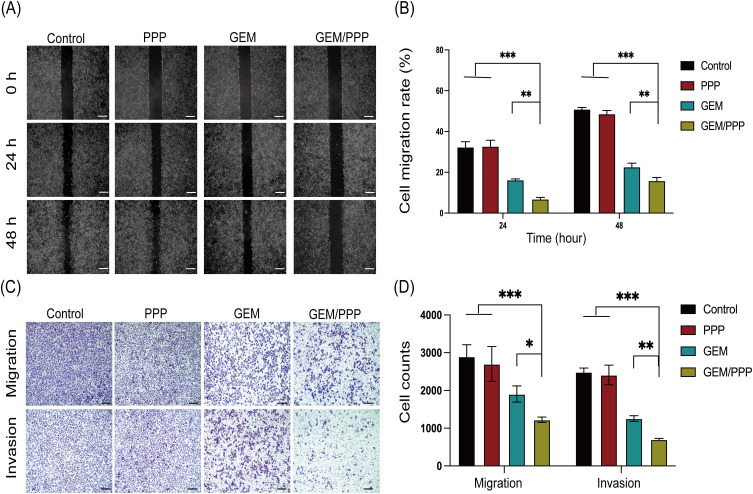
Figure 5.
Cell migration and invasion ability of PANC-1 cells in vitro. (A) Representative images of wound healing assay at 0h, 24h and 48h. (B) The quantitative analysis of wound healing assay. (C) Representative images of transwell assay. (D) The quantitative analysis of cells that passed the membrane in transwell assay. Scale bar is 200 μm. All data were obtained through three independent repeated experiments and presented as the mean ± SD. A significant difference was observed in the LSD post-hoc test. ***P < 0.001, **P < 0.01, *P < 0.05.

