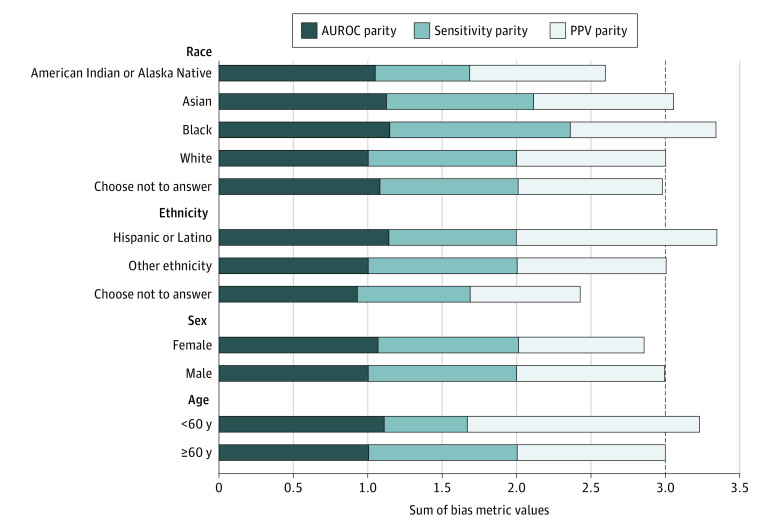
Figure 2. Variation in Model Performance.
Variation was measured by the sum of 3 bias measures across patient subgroups. Data were measured at the encounter level. Reference group parity values were equal to 1 for each individual bias measure within each subgroup. Reference groups were White patients, patients who identified as other ethnicity, male patients, and patients 60 years or older. The dashed line represents the reference group parity value for the sum of all 3 bias measures. AUROC indicates area under the receiver operating characteristic curve; and PPV, positive predictive value.

