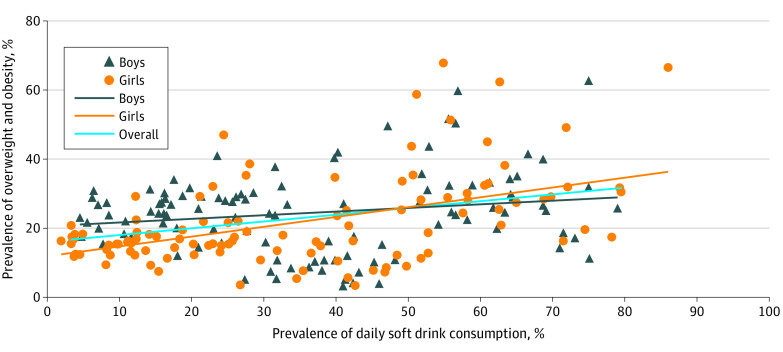
Figure. Prevalence of Overweight and Obesity by Soft Drink Consumption Across 107 Countries and Regions in the 2009-2017 Global School-Based Student Health Survey, 2017-2018 European Health Behavior in School-Aged Children, and 2019 US National Youth Risk Behavior Surveys.
Data are from the Global School-Based Student Health Survey (2009-2017), the European Health Behavior in School-Aged Children study (2017-2018), and the US Youth Risk Behavior Survey (2019). Consumption is the prevalence of daily soft drink consumption (1 or more times per day) among school-going adolescents. The partial correlation coefficient (each country has the same weight) is 0.44 (P < .001) for all students, 0.36 (P < .001) for males, and 0.50 (P < .001) for females, controlling for the mean age, percentage of female students (for the overall analysis), prevalence of daily fruit consumption, prevalence of daily vegetable consumption, percentage of physical activity, implementation of soft drink taxes, country income groups, and year of data collection.

