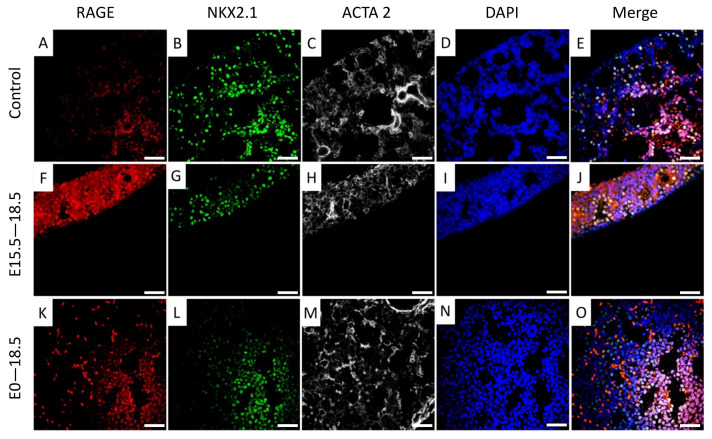
Figure 4.
Immunofluorescent staining revealed increased RAGE expression in TG mouse lungs ((F,K) vs. A) and diminished localization of NKX2.1 ((G,L) vs. B) and alpha smooth muscle actin (ACTA 2; (H,M) vs. C). DAPI counterstained images (D,I,N) and merged images that contains RAGE, NKX2.1, ACTA 2, and DAPI (E,J,O) are also depicted. All images are at 400× original magnification and scale bars represent 50 μm.

