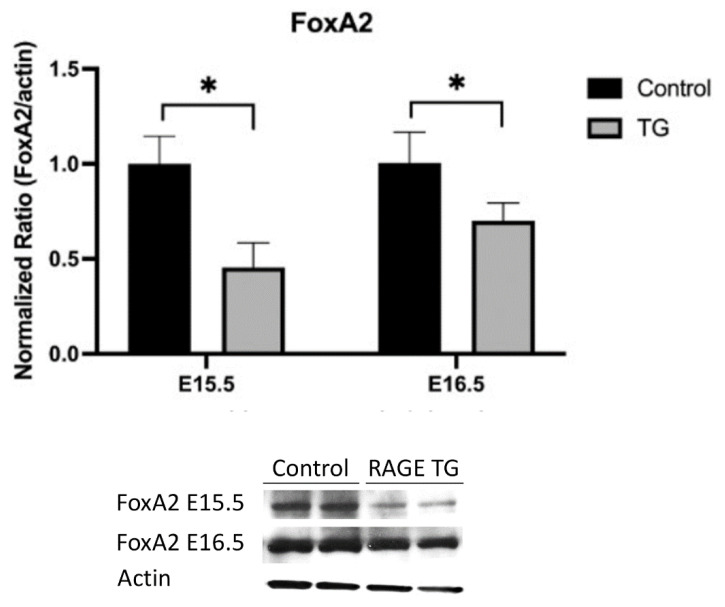
Figure 5.
Immunoblotting revealed decreased FoxA2 expression in RAGE TG mice compared to controls when RAGE was overexpressed from E0–15.5 or E0–16.5. * p ≤ 0.05; blots were densitometrically normalized to β-actin and images are representative of three different immunoblotting experiments performed in quadruplicate.

