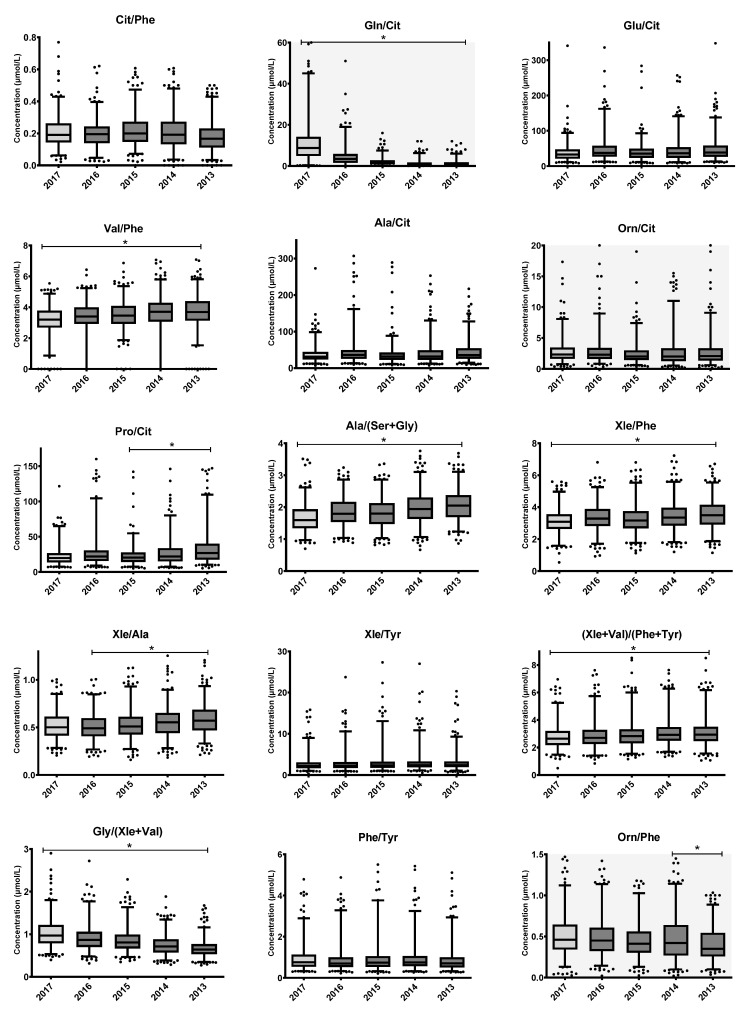
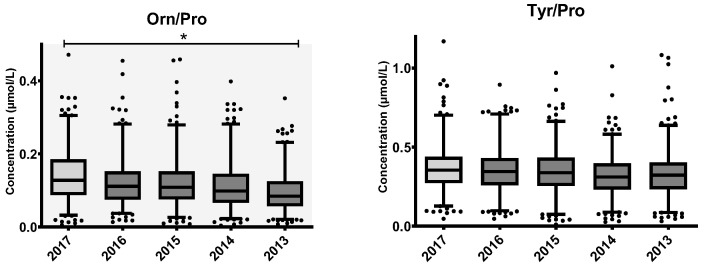
Figure 3.
Changes in AA ratios used in IMD diagnoses and monitoring upon long-term storage of DBS at RT. Boxplots represent the first quartile, median and third quartile. The whiskers extend to the 2.5th and 97.5th percentiles. Samples from 2017 were stored at +4 °C (light grey box), while other samples were transferred to storage at RT after one year (dark grey boxes). Individual dots represent non-extreme outliers. Asterisks ‘*’ above boxplots represent statistically significant trends in the concentration upon storage duration, as determined by Jonckheere’s trend test. Trend analyses of the ratios consisting of Arg, His or Met could not be interpreted because of (short-term) instability of these AAs. Assessment of Orn and Gln was possibly less reliable due to high CVs.


