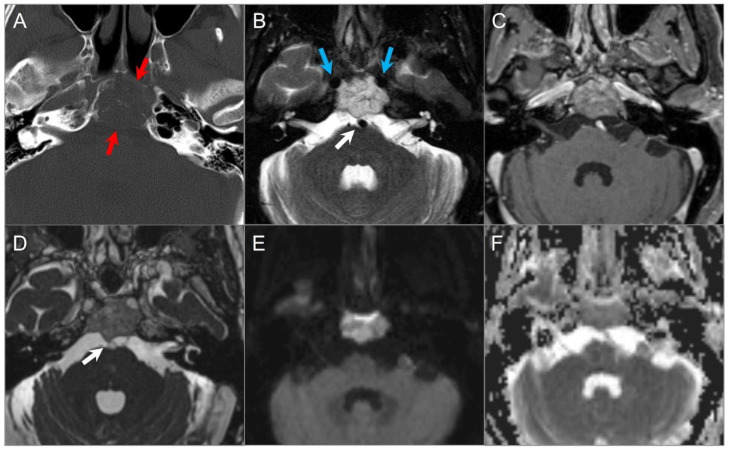
Figure 19.
Chordoma. (A) Axial CT image shows a well-defined lytic lesion in the clivus (red arrows) with associated erosion and minimal intratumoral calcifications. (B) Axial fat-suppressed T2W image reveals a marked T2 hyperintensity of the mass with linear hypointense septations, resulting in a ‘soap bubble’ appearance. Note: abutment of the bilateral ICAs (blue arrows). (C) Axial postcontrast T1W image demonstrates heterogeneous enhancement of the lesion. (D) Axial CISS image demonstrates bulging into the prepontine cistern and abutment to basilar artery (white arrow) without definite dural disruption. (E) DWI demonstrates increased signal and (F) ADC map shows similar diffusion characteristics with brain parenchyma in the lesion.

