
Figure 4. Head Size Associations With Polymicrogyria Categories.
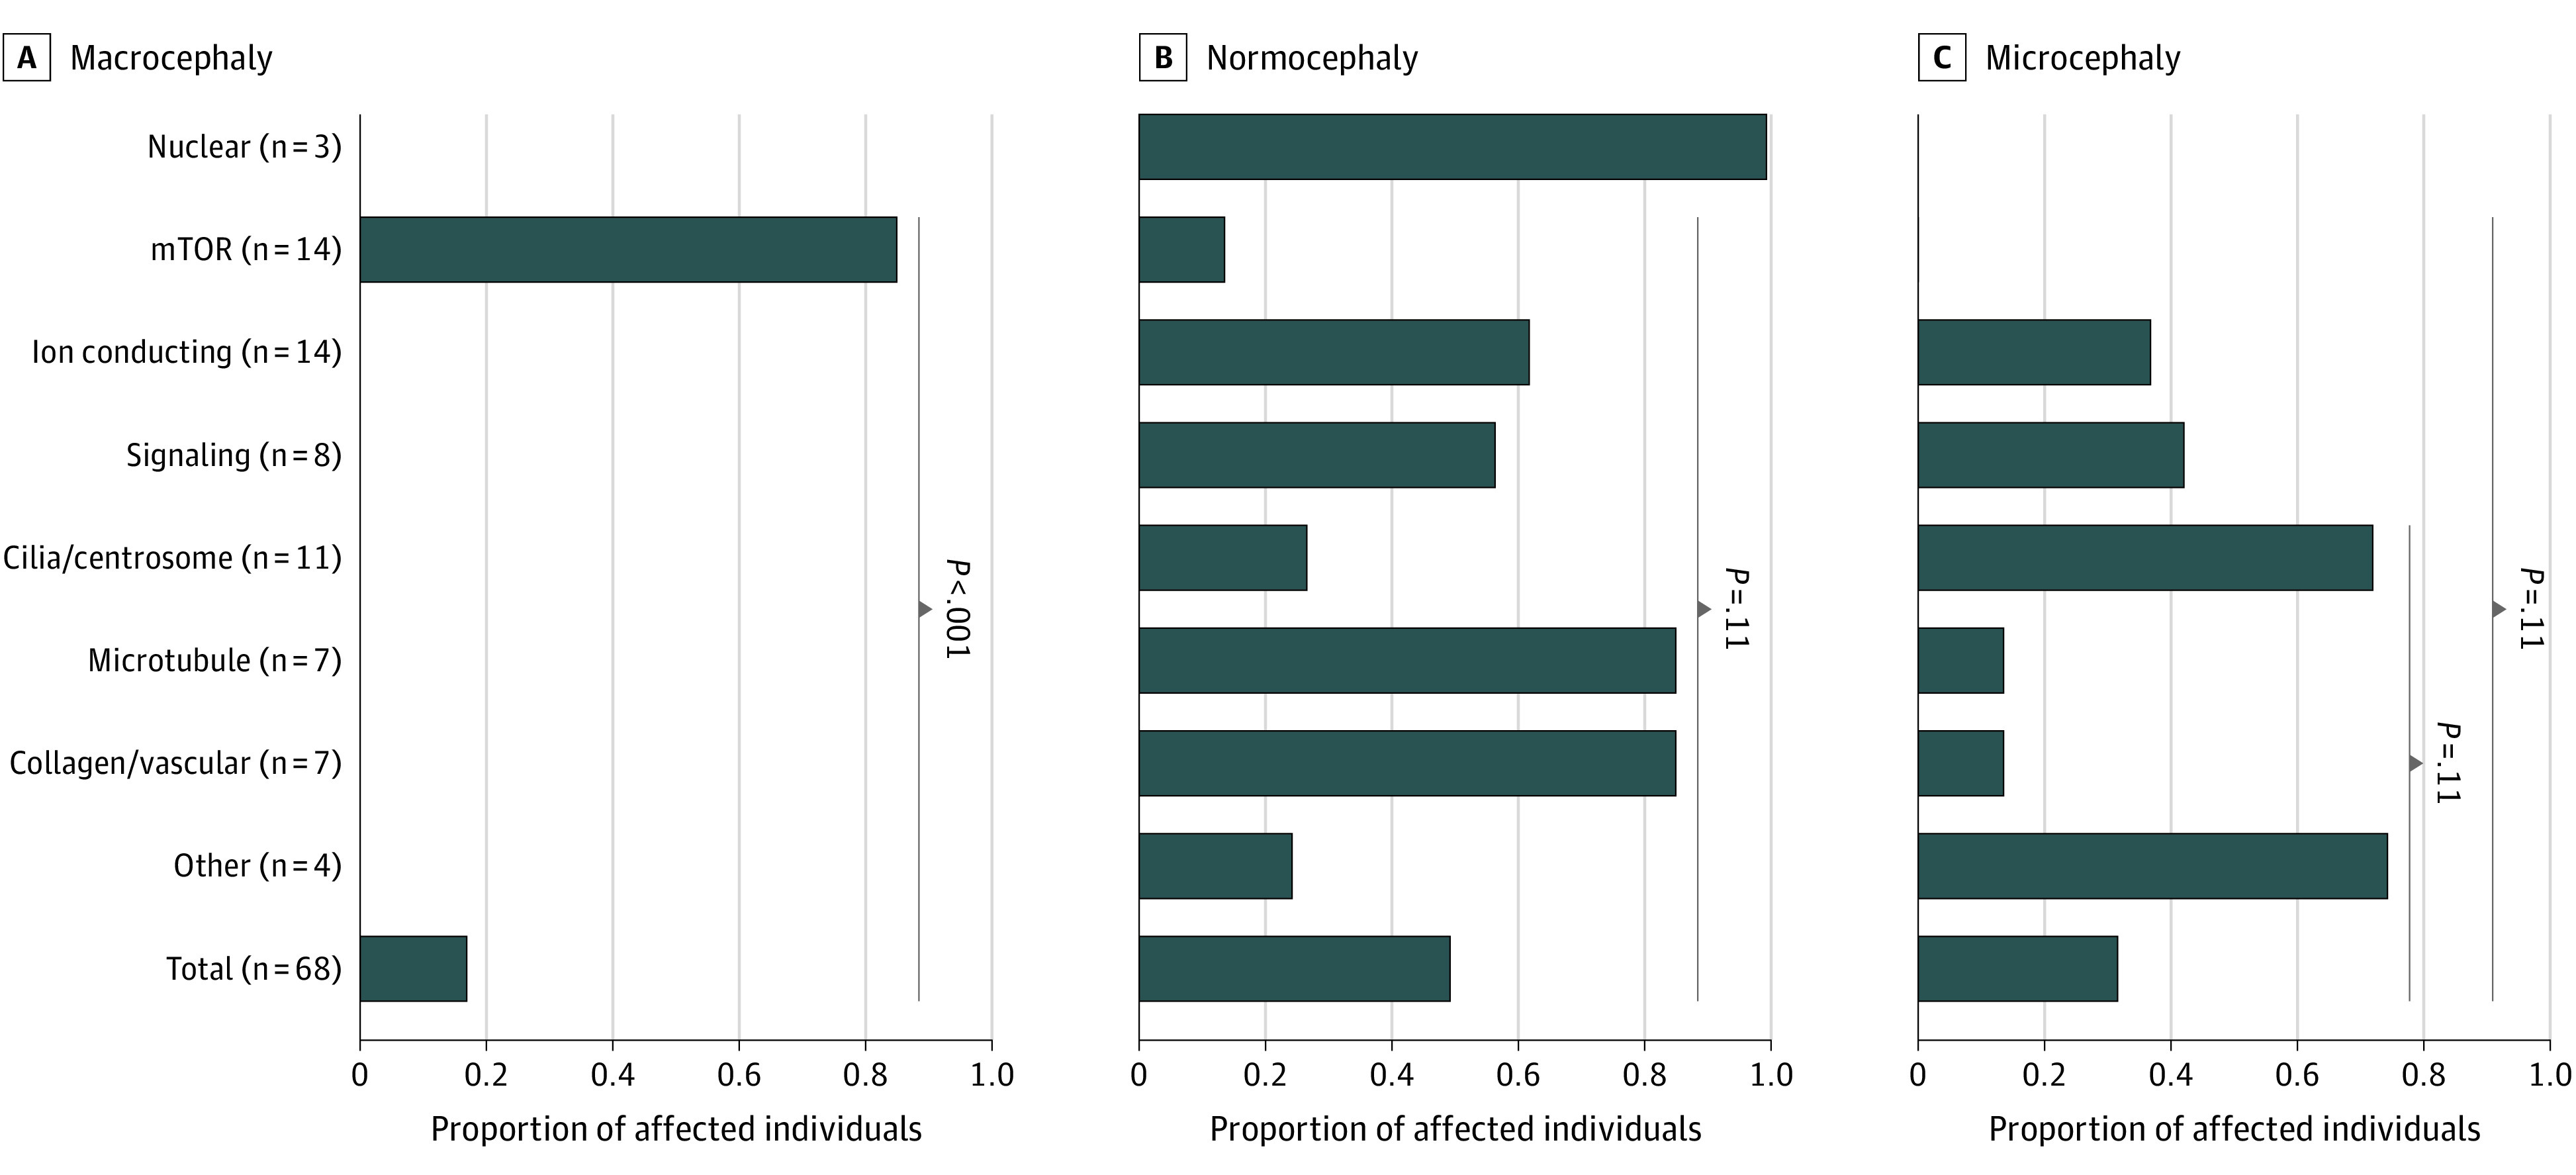
Proportion of individuals affected with polymicrogyria that have macrocephaly, normocephaly, or microcephaly in each gene category, compared with that in all affected individuals. Shown are the Fisher exact test comparisons yielding the 4 smallest Benjamini-Hochberg–adjusted P values. Macrocephaly was associated with the mTOR category specifically, and microcephaly was absent in this category.