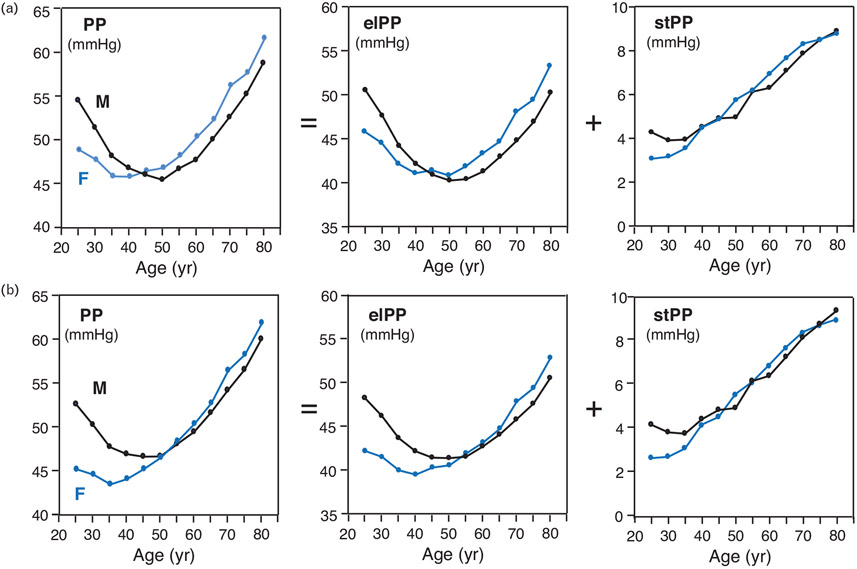
FIGURE 2.
Variation of pulse pressure variables with age stratified by sex. Data points represent means of each pulse pressure (PP) variable for age grouped in 5-year intervals, fully adjusted in (a) and adjusted to cohorts only in (b), determined using two-way ANOVA taking grouped age and sex as the independent variables. The covariables in (a) were cohorts, BMI, smoking and drinking, serum cholesterol, antihypertensive drug intake, history of cardiovascular disease and diabetes mellitus, and mean 24-h DBP and heart rate. The covariables for (b) were merely cohorts. Values of grouped age were ‘25’, ‘30’, …, and ‘80’, standing for, respectively, age 27.5 or less, 27.5 less than age, 32.5 or less, …, and age more than 77.5 years. The black and blue lines correspond, respectively, to males (‘M’) and females (‘F’). The ‘ = ’ and ‘ + ’ symbols reminds that PP is the sum of elPP and stPP. elPP, elastic pulse pressure; stPP, stiffening PP.

