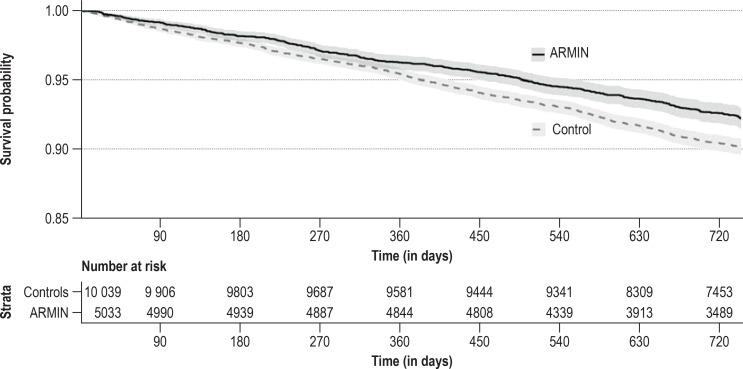
Figure 3.
Kaplan-Meier representation of survival times. Survival probabilities are shown stratified in the propensity score-matched analysis population for the ARMIN group (black continuous line) and the control group (dashed gray line) (log rank test: p <0.001; the difference between the groups for the restricted mean survival times [38] is 80 days, p <0.001 for individual values amongst ARMIN patients of 1720 days and amongst controls of 1640 days). ARMIN, Medicines Initiative Saxony-Thuringia

