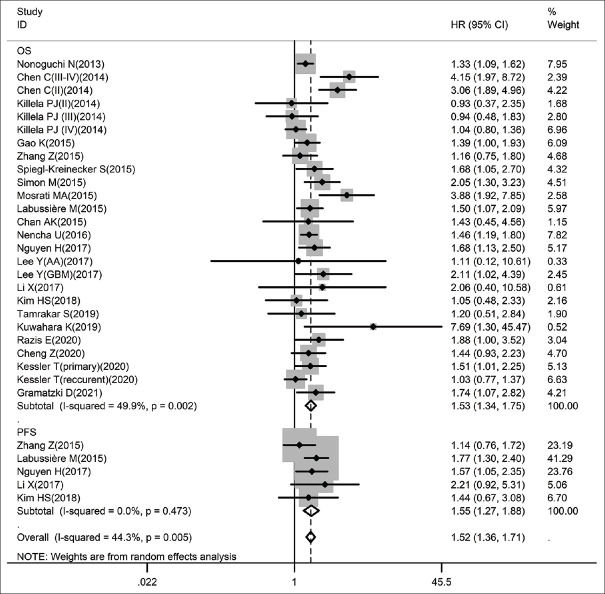
Figure 2.
Forest plots for studies on the association between pTERT mutation and OS/PFS in glioma among 28 studies included in the meta-analysis (Some contain multiple HRs). Results are presented as individual and pooled HR (95% CI). OS: Overall survival, PFS: Progression-free survival, HR: Hazard ratio, CI: Confidence interval

