
Figure 2.
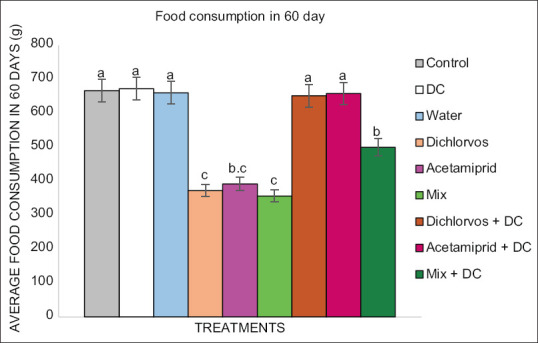
Comparison of food consumption in treated groups with pesticide and treated groups with pesticide and colostrum during 60 days. Different letters (a-c) indicate the significance of treatment groups (P < 0.01). Statistical testing: One way ANOVA and LSD P = 0.0001. The Dichlorvos and Acetamiprid groups received 0.5 and 1.5 ppm, respectively, and the mix group received both doses (0.5 and 1.5) alternately. The Dichlorvos + DC, Acetamiprid + DC, and Mix + DC groups received 0.2 ml of donkey colostrum per day in addition to pesticides. DC: Donkey colostrum, LSD: Least significant difference