
Figure 5. Fluorescence intensity analysis on giant unilamellar vesicles (GUVs).
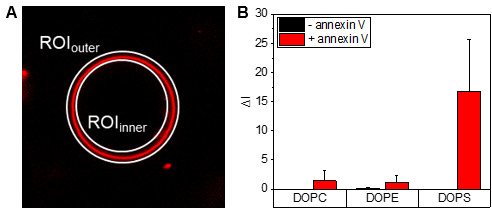
(A) A first region of interest (ROI) is placed around the GUV (ROIouter), and a second ROI is placed within the GUV lumen (ROIinner) of interest to measure the annexin V fluorescence intensity of the membrane, by measuring the integrated density value per pixel using the software ImageJ. (B) The mean annexin V fluorescence intensities for GUVs with the indicated lipid compositions are presented as averages, based on individual measurements of n ≤ 10 GUVs. Error bars indicate standard deviations. Data are from one experiment representative of two independent vesicle preparations.