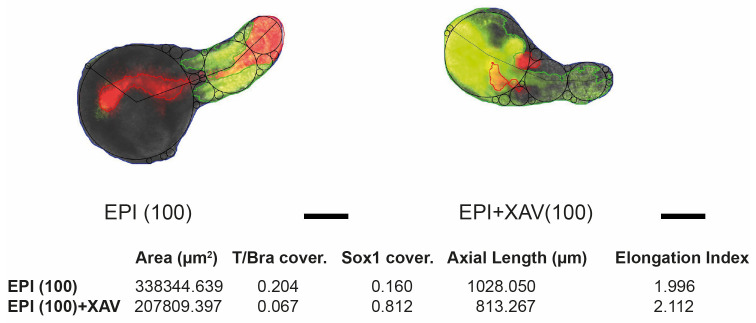
Figure 6. Representative post-analysis images of EPI and EPI+XAV aggregates at 168 h showing T/Bra (red) and Sox1 (green) expression domains and calculated coverage indices.
Black lines and circles indicate axial length and inscribed circles, respectively. Elongation index is calculated by dividing the axial length with the diameter of largest inscribed circle. Scale bars = 200 μm.

