
Figure 2.
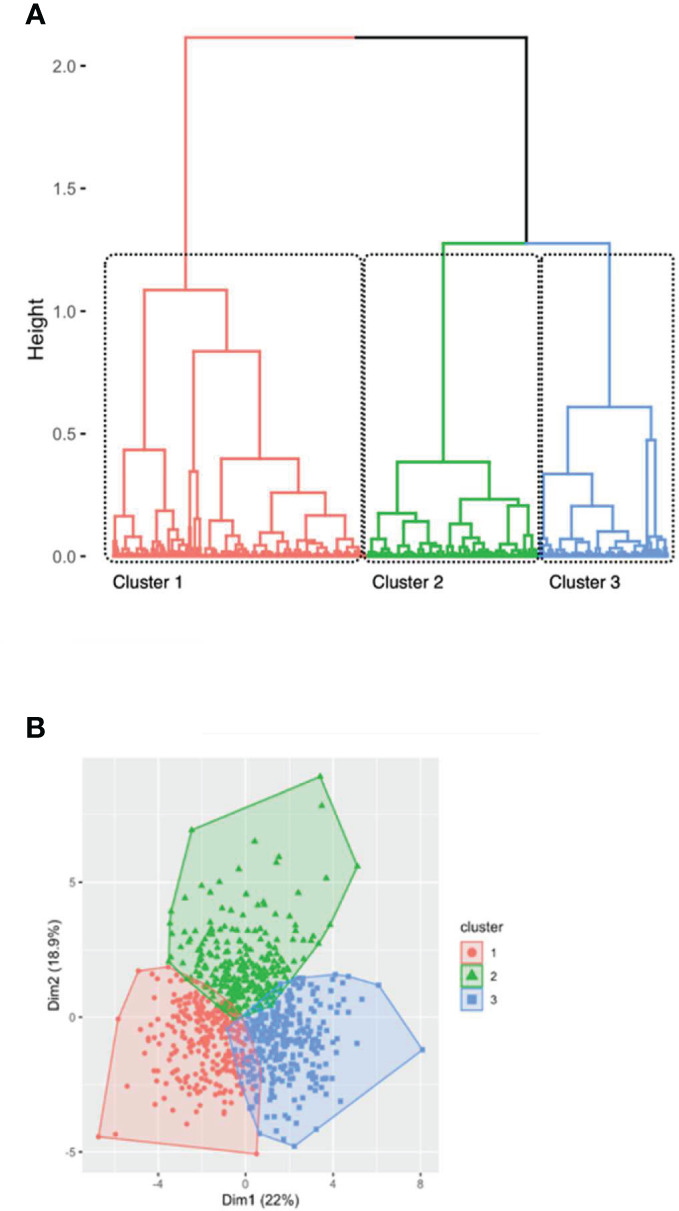
Hierarchical clustering of patients after principal component analysis (A) represented by the dendrogram of patients and (B) by a scatter view plot. (A) identification of 3 clusters among 832 first transplant recipients according to immunological data. Profiles were assigned based on the separation of the clustering trees. (B) Colors were based on clustering profile and mainly defined by dimension 2 and dimension 1 in our hierarchical clustering. Three clusters were identified: older immunity in red (cluster 1), activated immunity in green (cluster 2) and naïve immunity in blue (cluster 3).