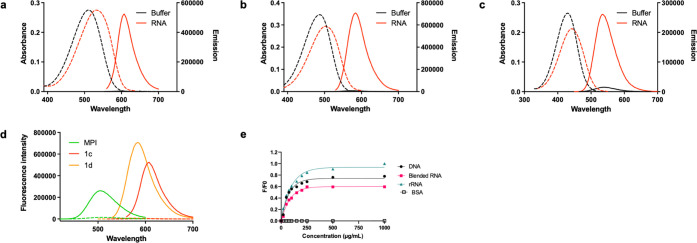
Figure 2.
Absorption and emission spectra of (a) 1c, (b) 1d, and (c) MPI in T.E. buffer (pH 7.5) or RNA (Type IV RNA from torula yeast; 200 μg/mL). Dye concentration: 10 μM. Dashed and solid lines indicate absorbance and emission, respectively. (d) Comparison of fluorescence intensity between MPI, 1c, and 1d in buffer vs dyes in RNA solution (200 μg/mL) dye concentration 10 μM. Dashed lines reflect the fluorescence intensity of unbound dye, and solid lines indicate the fluorescence intensity of dyes in RNA solution. (e) Fluorescence titration of 1c (10 μM) incubated with increasing concentration of nucleic acids or protein (BSA; bovine serum albumin).

