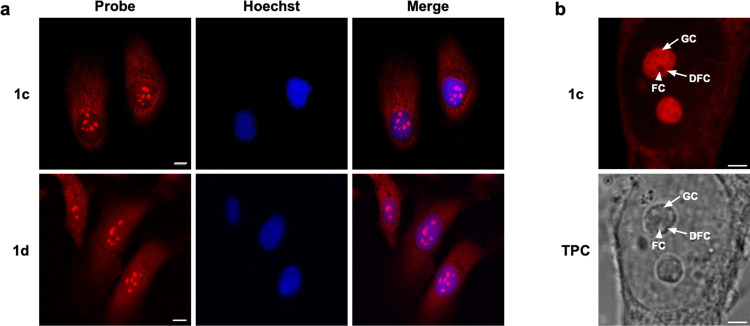
Figure 4.
(a) Confocal fluorescence images of PFA-fixed HeLa cells incubated with 20 μM 1c and 1d for 30 min and 1 μg/mL Hoechst 33342 for 30 min. Scale bar: 10 μm. (b) Zoomed-in image of HeLa cells stained with 20 μM 1c for 30 min. Image shows the subnucleolar components FC (indicated by the white arrowhead), DFC, and GC (indicated by the white arrows). TPC: transmission phase contrast. Scale bar: 3 μm.

