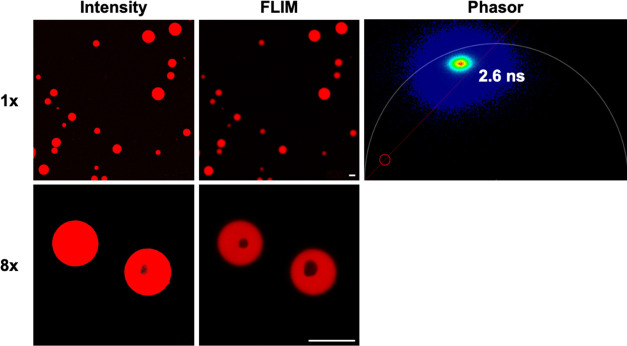
Figure 7.
Partitioning of 1c (10 μM) within the RNA/spermine condensates. The top row shows images enlarged by 1×, while the bottom row shows images enlarged by a factor of 8×. The left column shows images based on fluorescence intensity alone, and the middle column shows images resolved using FLIM. The phasor plot indicates the presence of a single lifetime species of 1c (2.6 ns). Scale bar: 10 μm.

