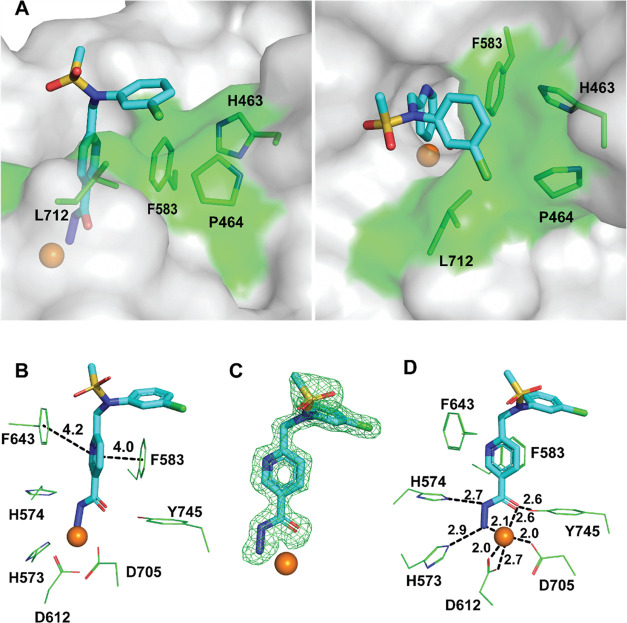
Figure 2.
Crystal structure of the zHDAC6/4 complex (PDB entry 8BJK). (A) Interactions between the chlorophenyl cap and the L1-loop pocket formed by residues H463, P464, F583, and L712 (semitransparent cyan surface representation). (B) π–π stacking interactions between 4 and HDAC6 residues are shown as dashed lines. (C) The Fo–Fc omit map (green) is contoured at 3.0 σ, and the fitted inhibitor is shown in stick representation. (D) Details of bidentate active-site zinc ion coordination by the hydrazide function. HDAC6 residues are shown as lines with atoms colored green (carbon), red (oxygen), and blue (nitrogen), and the inhibitor is shown in stick representation with atoms colored cyan (carbon), yellow (sulfur), and green (chlorine). The Zn2+ ion is shown as an orange sphere. Distances (in Å) are shown as dashed lines.

