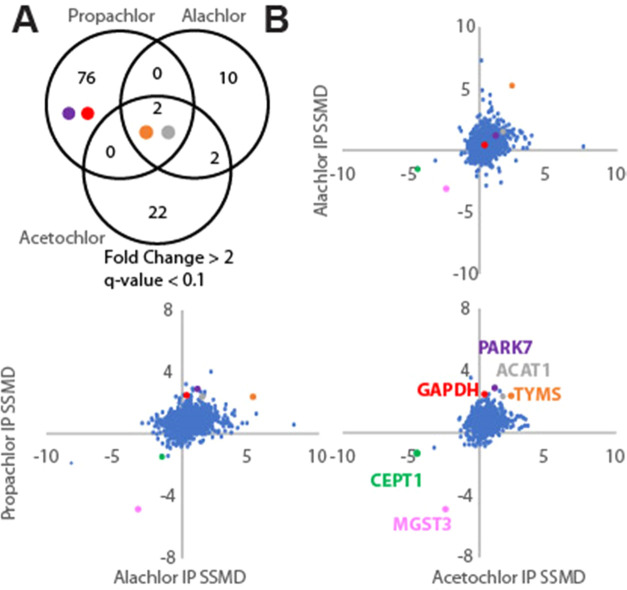
Figure 3.
Comparison of proteome-wide Hsp40 affinity changes from the three chloroacetanilide herbicide treatments. (A) Comparison of the most impacted proteins and (B) comparison of strictly standardized mean differences (SSMDs; treatment vs control). Coloring of points in this figure is used consistently to show relative reactivities of PARK7, ACAT1, TYMS, GAPDH, CEPT1, and MGST3.

