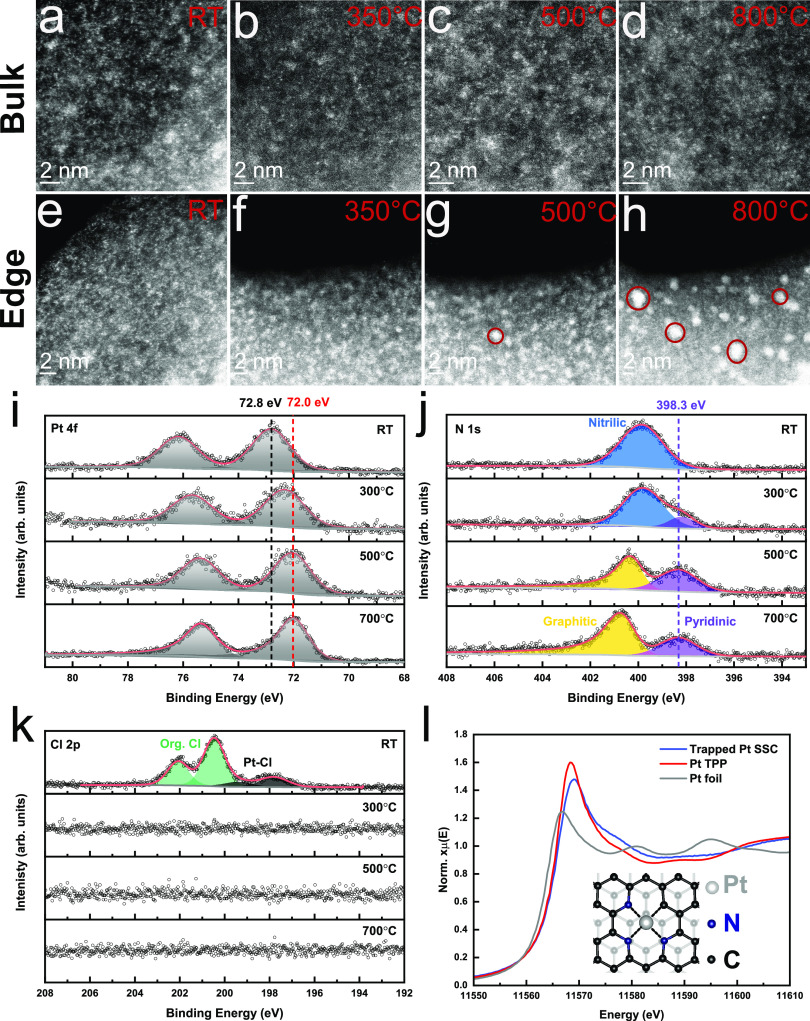
Figure 3.
In situ heating STEM images showing the spacial evolution of Pt sites at the bulk (a–d) and edge (e–h) in a sample with 10 wt% Pt on PANI with increasing temperatures (RT, 350 °C, 500 °C, and 800 °C) under vacuum. (i–k) Temperature-dependent XPS data of 1 wt% Pt-PANI under vacuum to show how the bonding environment of Pt evolves during pyrolysis. Pt 4f spectra (i), N 1s spectra (j), and Cl 2p spectra (k). (l) XANES of the trapped Pt-SSC synthesized by pyrolysis, compared with the Pt TPP complex and Pt foil. The inset is a schematic of the trapped Pt-SSC structure; black for carbon, blue for N, and gray for Pt.

