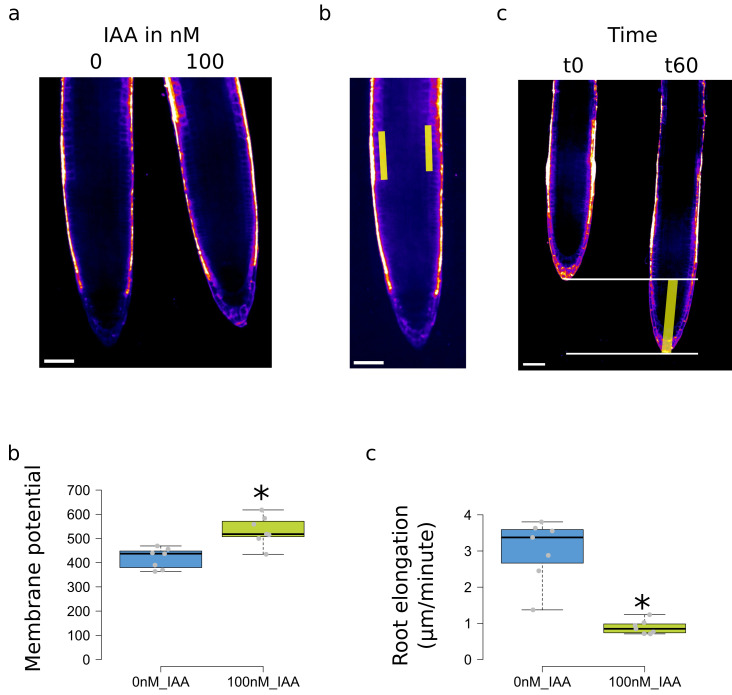
Figure 3. Measurements and plotting in solid media experiments.
(a) Example of images with the gray values represented as a LUT. (b) Selection of the transition zone at the intersection between cortex and epidermis. (c) Measurements of root elongation. (d) Measured membrane potential fluorescence and (e) root elongation, values of Col-0 treatment with 0 or 100 nM IAA. Scale bar: 50 μm. For (d) and (e), the * represents a p-value < 0.05, obtained by a non-parametric Student test (npar.t.test function in the R nparcomp package).

