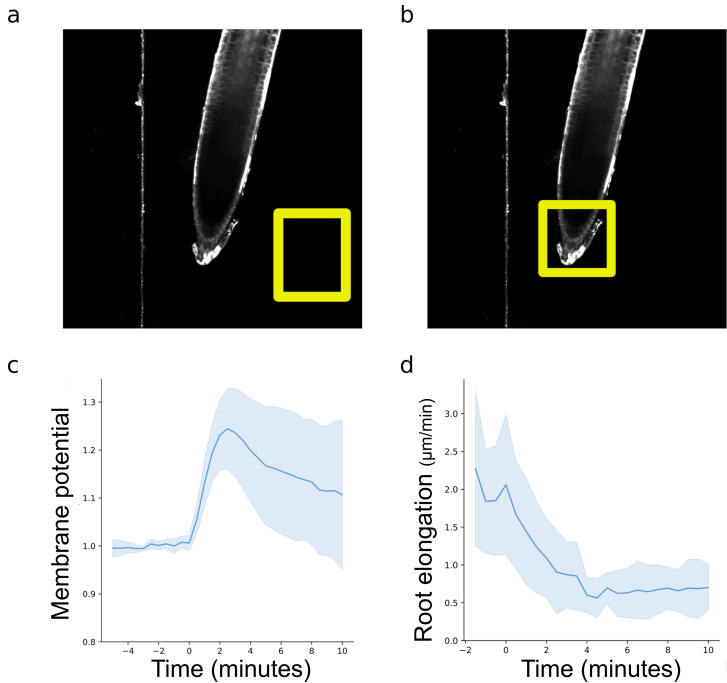
Figure 4. Measurements and plotting microfluidic experiments.
(a) Selection of a background region of interest to determine the treatment arrival. (b) Rectangular selection of the root tip to determine root elongation rates over time. (c) Measured and normalized DISBAC2(3) fluorescence reflecting the membrane potential and (d) root elongation; values of Col-0 observed 5 min in control and then 10 min with IAA 100 nM. For (c) and (d), negative values represent the root being exposed to the control medium, and positive values represent the root being exposed to the treatment medium.

