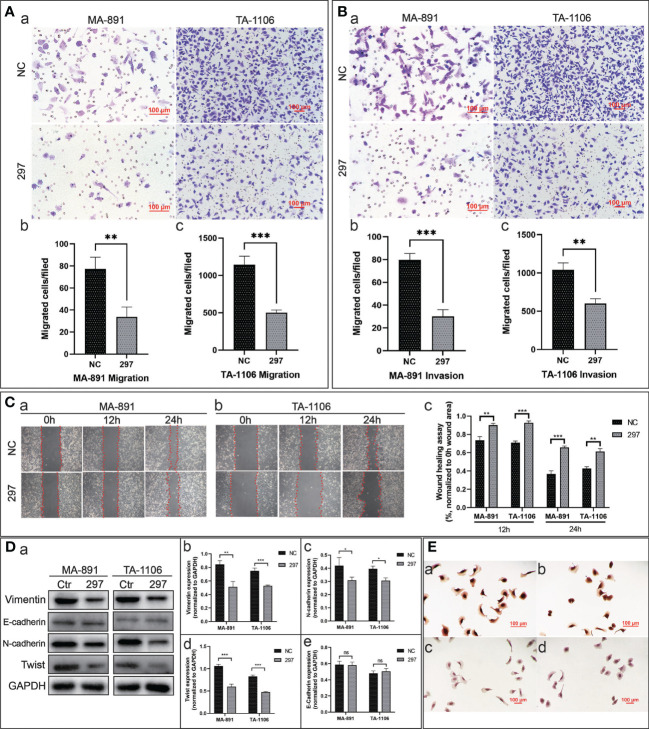
Figure 3.
FGF3 knockdown inhibited the migration and invasion abilities of MA-891 and TA-1106 cells. (A) Cell migration of siRNA-NC and siRNA-297 cells was assessed by a transwell assay (a). The quantitative analysis results of the transwell migration experiment in MA-891 (b) and TA-1106 (c) after transfection with siRNA-NC or siRNA-297. Each bar represents the mean ± standard deviation (SD) of three independent experiments. (B) The cell invasion ability of siRNA-NC and siRNA-297 cells was assessed by a matrigel-coated transwell assay (a). The quantitative analysis results of the transwell invasion experiment in MA-891 (b) and TA-1106 (c) after transfection with siRNA-NC or siRNA-297. (C) The scratch wound healing assay was used to assess the cell migration capacity of MA-891 (A) and TA-1106 cells (B) transfected with siRNA-NC or siRNA-297. A histogram showing the quantitative comparison of scratch wound healing assay results (c). (D) Comparison of expression levels of EMT markers between siRNA-297 and siRNA-NC cells by western blot analysis (a). Histograms showing the quantitative results of vimentin (b), N-cadherin (c), Twist (d), and E-cadherin (e) expression in MA-891 and TA-1106 cells transfected with siRNA-NC or siRNA-297. (E) Expression levels of N-cadherin in siRNA-NC-transfected MA-891 (a) and TA-1106 cells (b) were detected by ICC, as were the results of siRNA-297-transfected MA-891 (c) and TA-1106 cells (d). Statistically significant differences are indicated as ***P <0.001; **P <0.01; *P v0.05; and ns = not significant. FGF3, fibroblast growth factor 3; EMT, epithelial-mesenchymal transition; TA2, Tientsin albino; ICC, immunocytochemistry.

