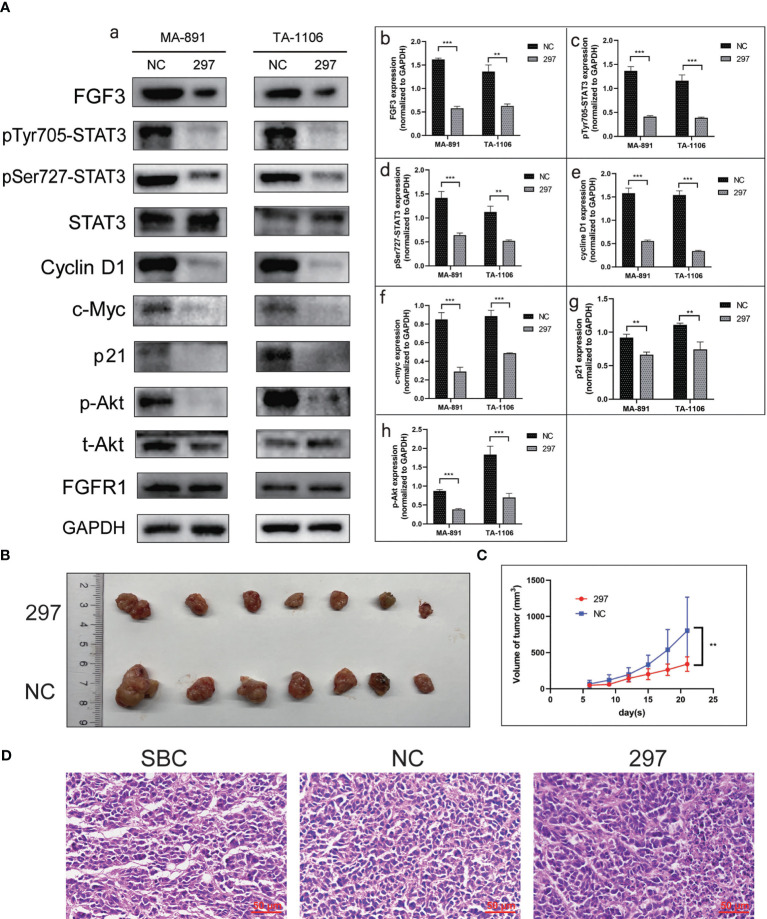
Figure 4.
FGF3 knockdown suppressed STAT3 and Akt-related pathways as well as the growth of xenografts. (A) Western blot results showed expression levels of FGF3, p-STAT3Tyr705, p-STAT3Ser727, STAT3, Cyclin D1, c-Myc, p21, p-Akt, t-Akt, and FGFR1 in siRNA-297 and siRNA-NC cells (a). Histograms of quantitative differences in expression of FGF3 (b), p-STAT3Tyr705 (c), p-STAT3Ser727 (d), Cyclin D1 (e), c-Myc (f), p21 (g), and p-Akt (h) in siRNA-NC and siRNA-297-transfected MA-891 and TA-1106 cells. Each bar represents the mean ± standard deviation of three independent experiments. Statistically significant differences are indicated as: ***P <0.001; **P <0.01. (B) Comparison of siRNA-297 and siRNA-NC cell xenografts. (C) Tumor growth curves of TA2 mouse xenografts, MA-891 siRNA-297 cells, and siRNA-NC cells are compared. Statistically significant differences are indicated as **P <0.01. (D) H&E staining was used to compare the morphology of SBC, siRNA-NC and siRNA-297-transfected MA-891 cell xenografts. SBC, spontaneous breast cancer; t-Akt, total Akt; p-Akt, phosphorylated-Akt; FGF3, fibroblast growth factor 3; H&E, hematoxylin and eosin; TA2, Tientsin albino 2.

