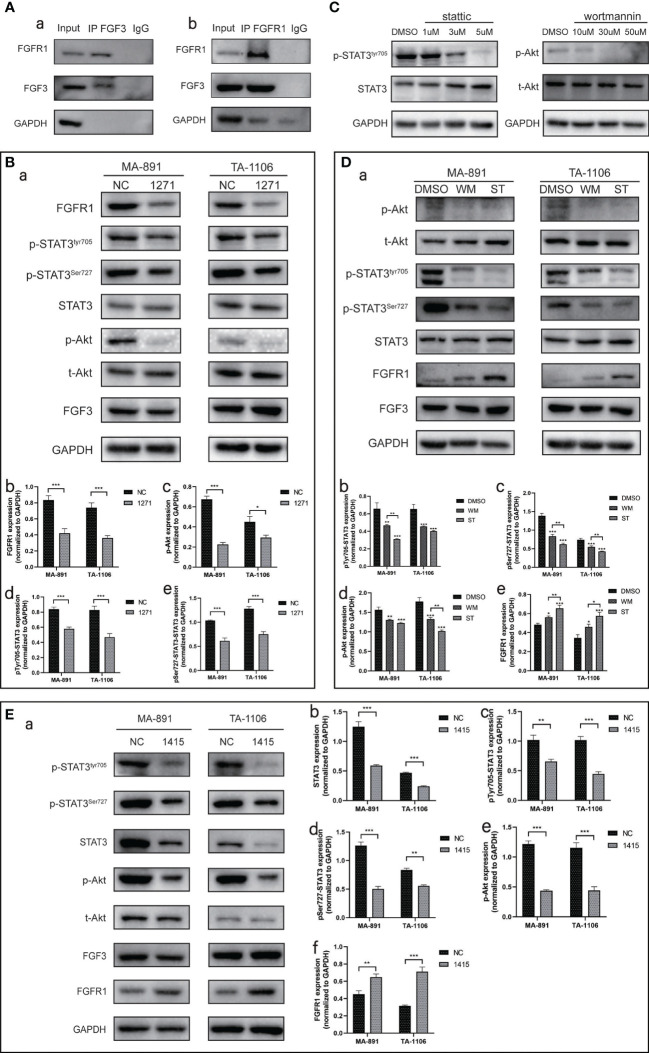
Figure 6.
The expression of FGF3-related proteins. (A) Co-IP experiments were performed on MA-891 cells using either FGF3 (a) or FGFR1 (b) as bait to examine the binding of FGFR1 and FGF3, respectively. (B) The expression levels of FGFR1, p-STAT3Tyr705, p-STAT3Ser727, STAT3, p-Akt, t-Akt, and FGF3 in siRNA-NC and siRNA-1271 cells were compared after FGFR1 was knocked down (a). Histograms of quantitative differences in the expression of FGFR1 (b), p-Akt (c), p-STAT3Tyr705 (d), and p-STAT3Ser727 (e) in siRNA-NC and siRNA-297-transfected MA-891 and TA-1106 cells. Each bar represents the mean ± standard deviation of three independent experiments. Statistically significant differences are indicated as: ***P < 0.001; **P <0.01; *P <0.05. (C) Expression levels of p-STAT3Tyr705 and p-Akt under the treatment of different concentration gradients of ST and WM, respectively. (D) Effects of WM and ST treatment on p-Akt, t-Akt, p-STAT3Tyr705, p-STAT3Ser727, STAT3, FGFR1, and FGF3 levels (a). Histograms of quantitative differences in expression of p-STAT3Tyr705 (b), p-STAT3Ser727 (c), p-Akt (d), and FGFR1 (e) in DMSO, WM, and ST-treated MA-891 and TA-1106 cells. (E) STAT3 was knocked down by siRNA-1415, and the expression levels of p-STAT3Tyr705, p-STAT3Ser727, STAT3, p-Akt, t-Akt, FGF3, and FGFR1 were compared between siRNA-NC and siRNA-1415 cells (a). Histograms of quantitative differences in expression of STAT3 (b), p-STAT3Tyr705 (c), p-STAT3Ser727 (d), p-Akt (e), and FGFR1 (f) in siRNA-NC and siRNA-1415-transfected MA-891 and TA-1106 cells. Co-IP, co-immunoprecipitation; t-Akt, total Akt; p-Akt, phosphorylated-Akt; DMSO, dimethyl sulfoxide; WM, Wortmannin; ST, Stattic; FGF3, fibroblast growth factor 3; FGFR1, fibroblast growth factor receptor 1; TA2, Tientsin albino 2.

