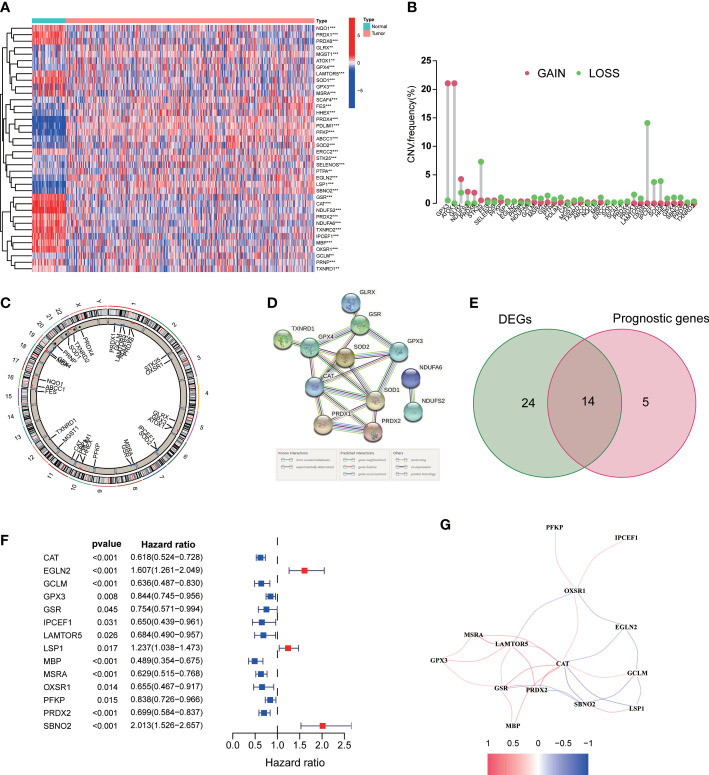
Figure 2.
Expression of the ROS-related genes in ccRCC. (A) ROS-related DEGs in ccRCC and adjacent benign samples. (B) Frequencies of CNV gain and loss among DEGs. (C) The location of CNV alteration of DEGs on chromosomes. (D) PPI network. (E) Venn diagram of 38 DEGs and 19 prognostic genes. (F) Univariate Cox regression analysis of 14 prognostic genes. (G) The correlation network of 14 DEGs. **p<0.01 and ***p<0.001.

