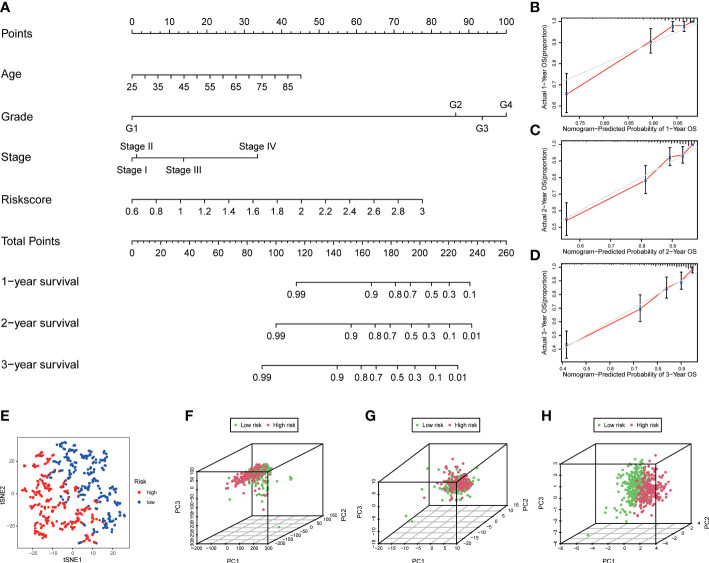
Figure 5.
Construction of nomogram and distribution patterns. (A) The nomogram predicted the 1-, 2-, and 3-year overall survival rates. (B–D) Calibration curves for the nomogram. (E) t-SNE analysis. 3D PCA between the low- and high-risk groups based on (F) genome-wide expression profiles, (G) all ROS-related genes, and (H) four ROS-related genes.

