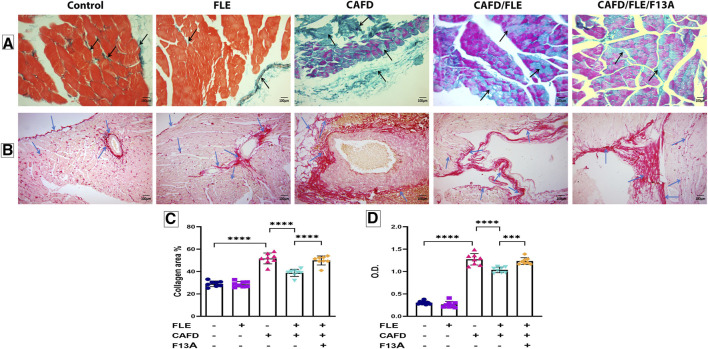
FIGURE 7.
Photomicrographs of (A) Masson’s trichrome- and (B) Periodic acid–Schiff (PAS)-stained sections of cardiac muscles, (C) collagen area percentage, and (D) optical density (O.D.) of PAS reaction in rat groups. Masson’s trichrome and PAS; X200. Black arrows: collagen fibers. Blue arrows: positive reaction to the PAS stain. Data are presented as the mean ± SD (n = 6 per group; one-way ANOVA followed by Tukey’s multiple comparison test; *** p < 0.001, **** p < 0.0001). CAFD, cafeteria diet; FLE, flaxseed lignan extract, F13A; an apelin-13 receptor blocker.

