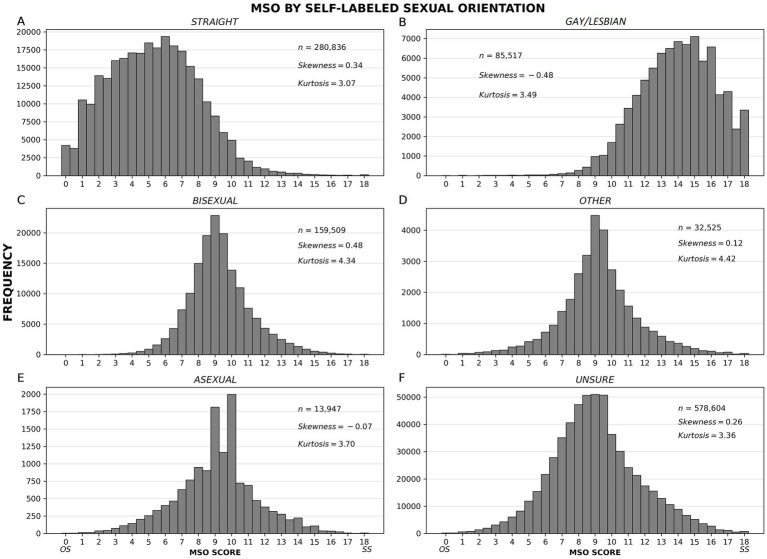
Figure 2.
Frequency distributions of MSO scores by self-labeled sexual orientation. Separate distributions are shown for people self-labeled as follows: straight, gay/lesbian, bisexual, other, asexual, and unsure (A–F). If discrete categories were sufficient to define SO, we would see non-overlapping distributions. Instead, each SO label corresponds to a broad, skewed distribution, meaning (a) that the labels do not describe discrete categories, and (b) that there is often a mismatch between the label people use to describe their SO and their actual sexual attractions, fantasies, and behaviors.

