
Extended Data Fig. 10 |. Enzymatic characterization of the α-glucosidase Bl_Glc31.
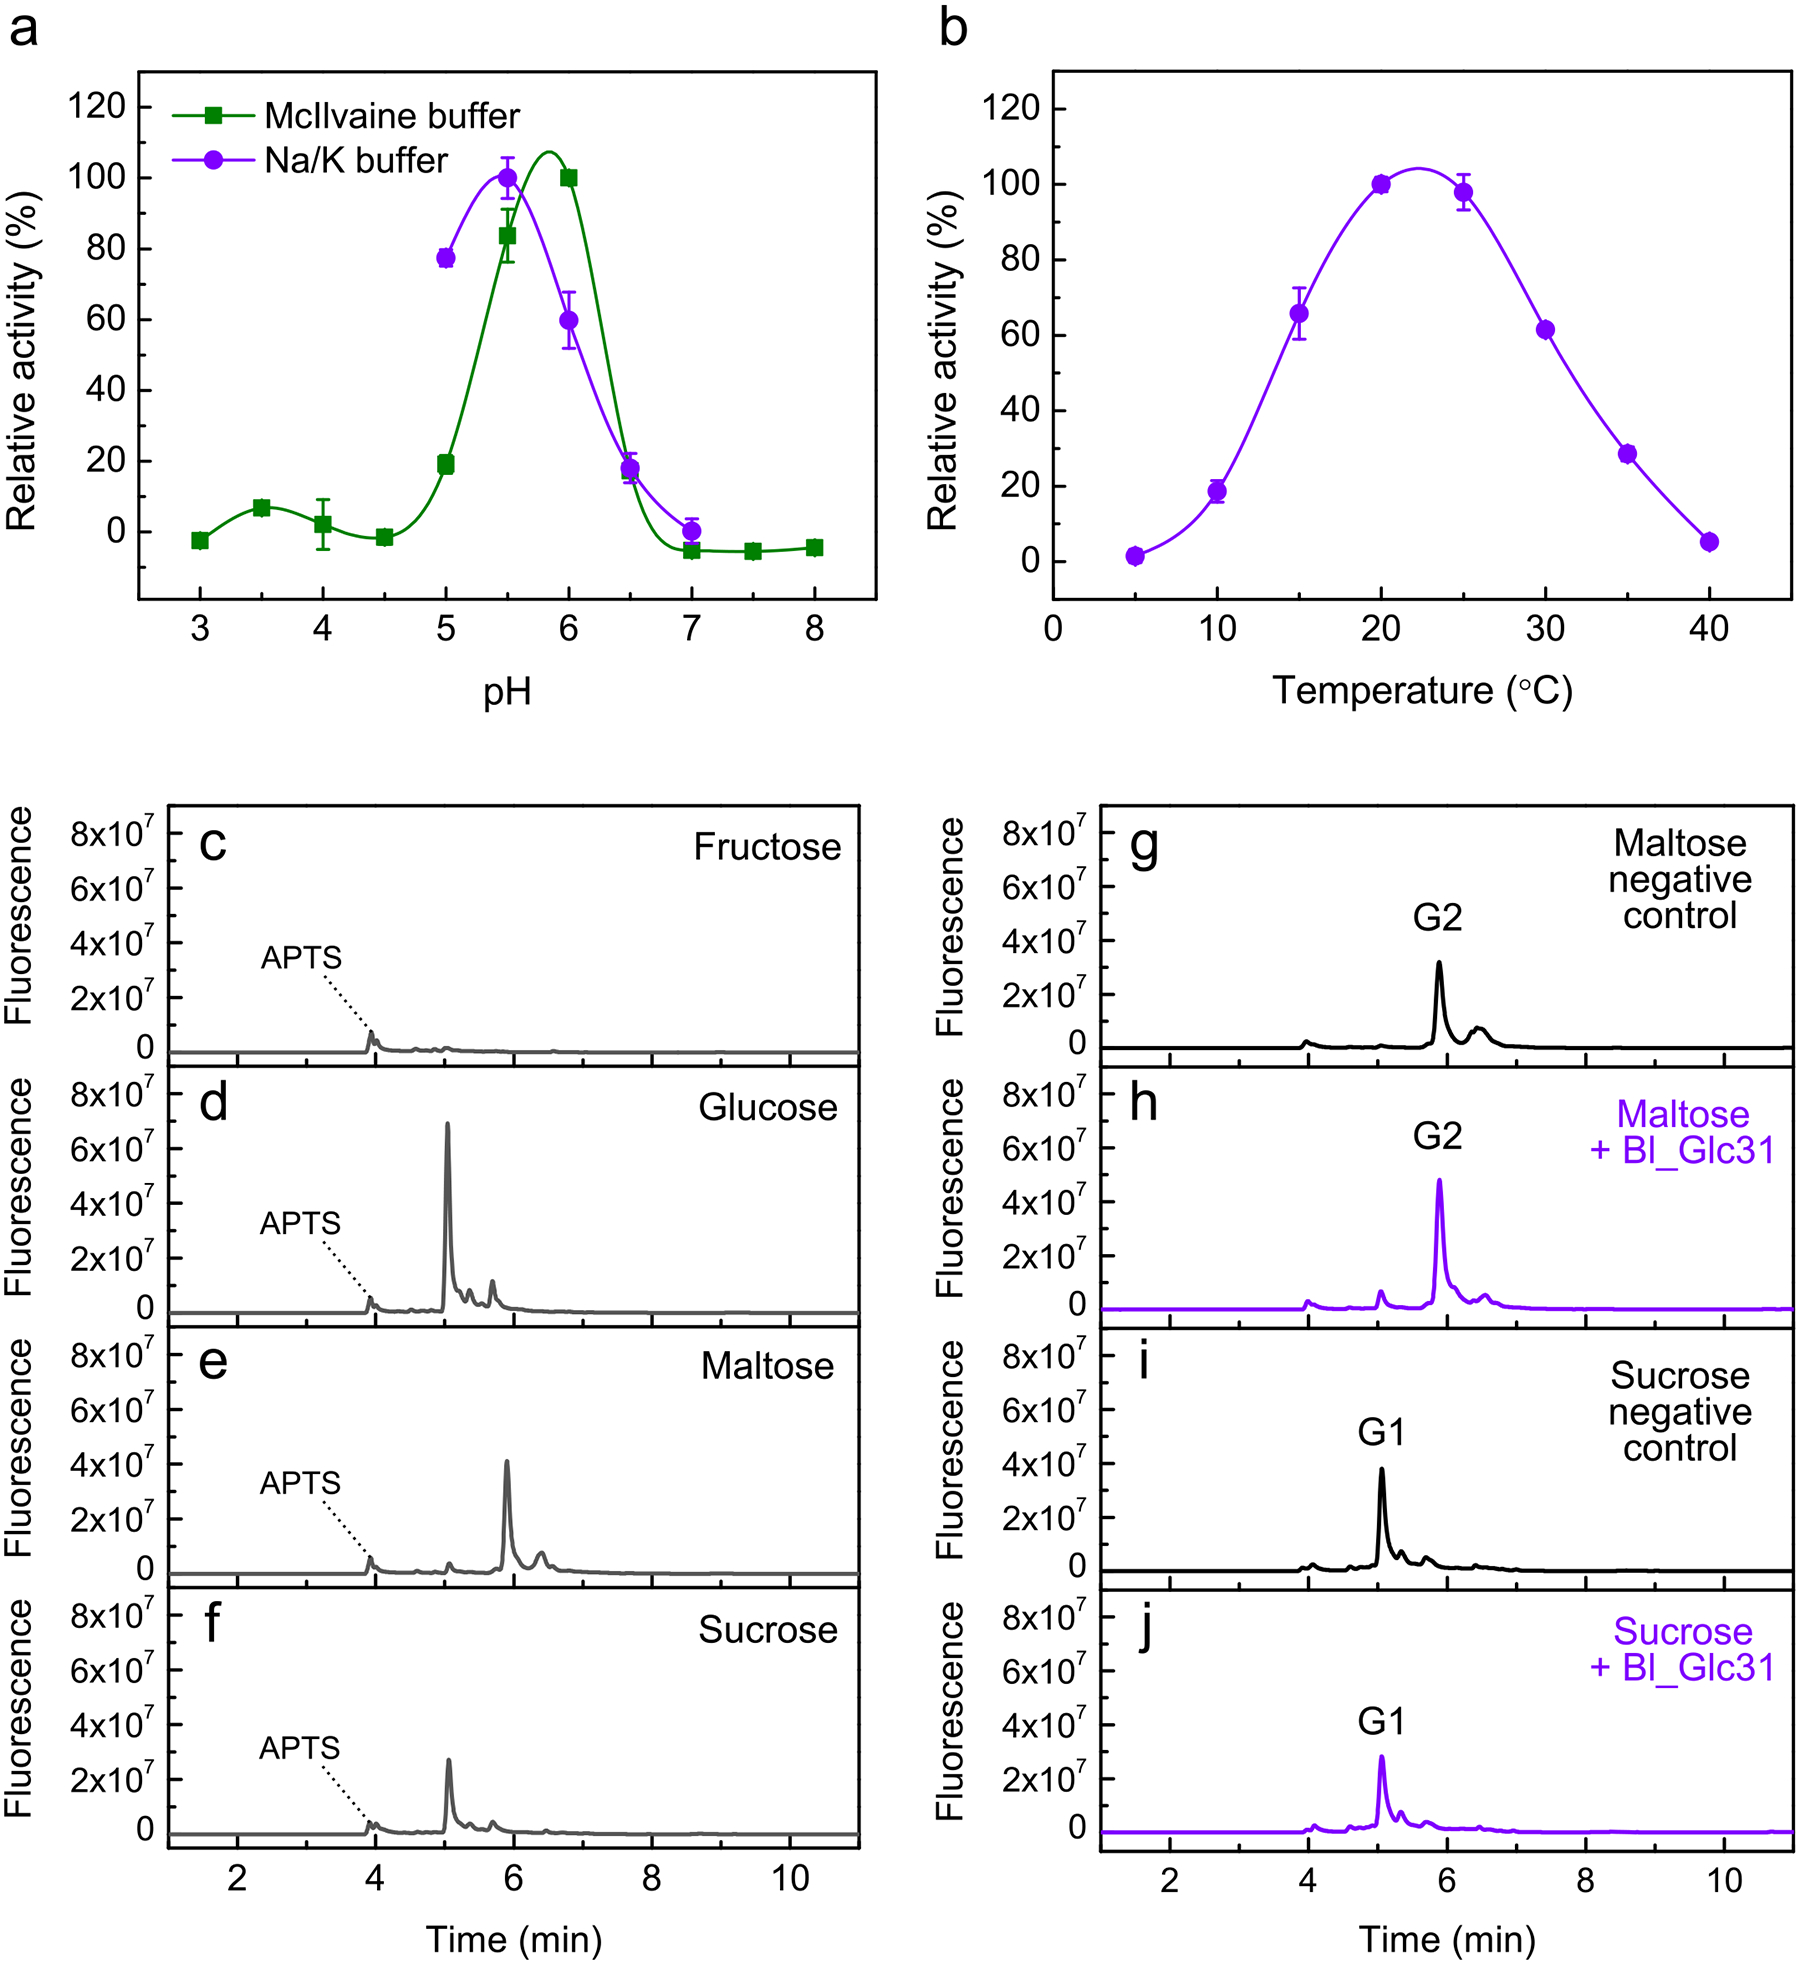
Enzyme activity was analyzed by colorimetric (a, b) and capillary electrophoresis methods (c–j). a, Relative activity of Bl_Glc31 on pNP-α-Glc in function of pH in reactions containing McIlvaine buffer (green) and 200 mM sodium/potassium phosphate (purple) buffers. b, Relative activity of Bl_Glc31 over pNP-α-Glc in 200 mM sodium/potassium phosphate buffer in function of temperature. Data from panels a and b are shown as mean ± SD from three independent experiments (n = 3). c–f, Capillary electrophoresis patterns for fructose (c), glucose (d), maltose (e) and sucrose (f). Note that in the sucrose profile only contaminant glucose is observed, and no sucrose is detected due to its lack of reactivity with APTS. (g–j) Reactions of Bl_Glc31 against maltose and sucrose as putative substrates in optimal conditions of the enzyme (200 mM sodium/potassium phosphate buffer pH 5.5, at 25 °C) for 16 hrs. Due to the long reaction time, negative controls without enzyme were performed to verify possible spontaneous hydrolysis of maltose (g) and sucrose (i). In 4 min of elution, a peak of APTS is seen for all the reactions. G2 = maltose. G1 = glucose.