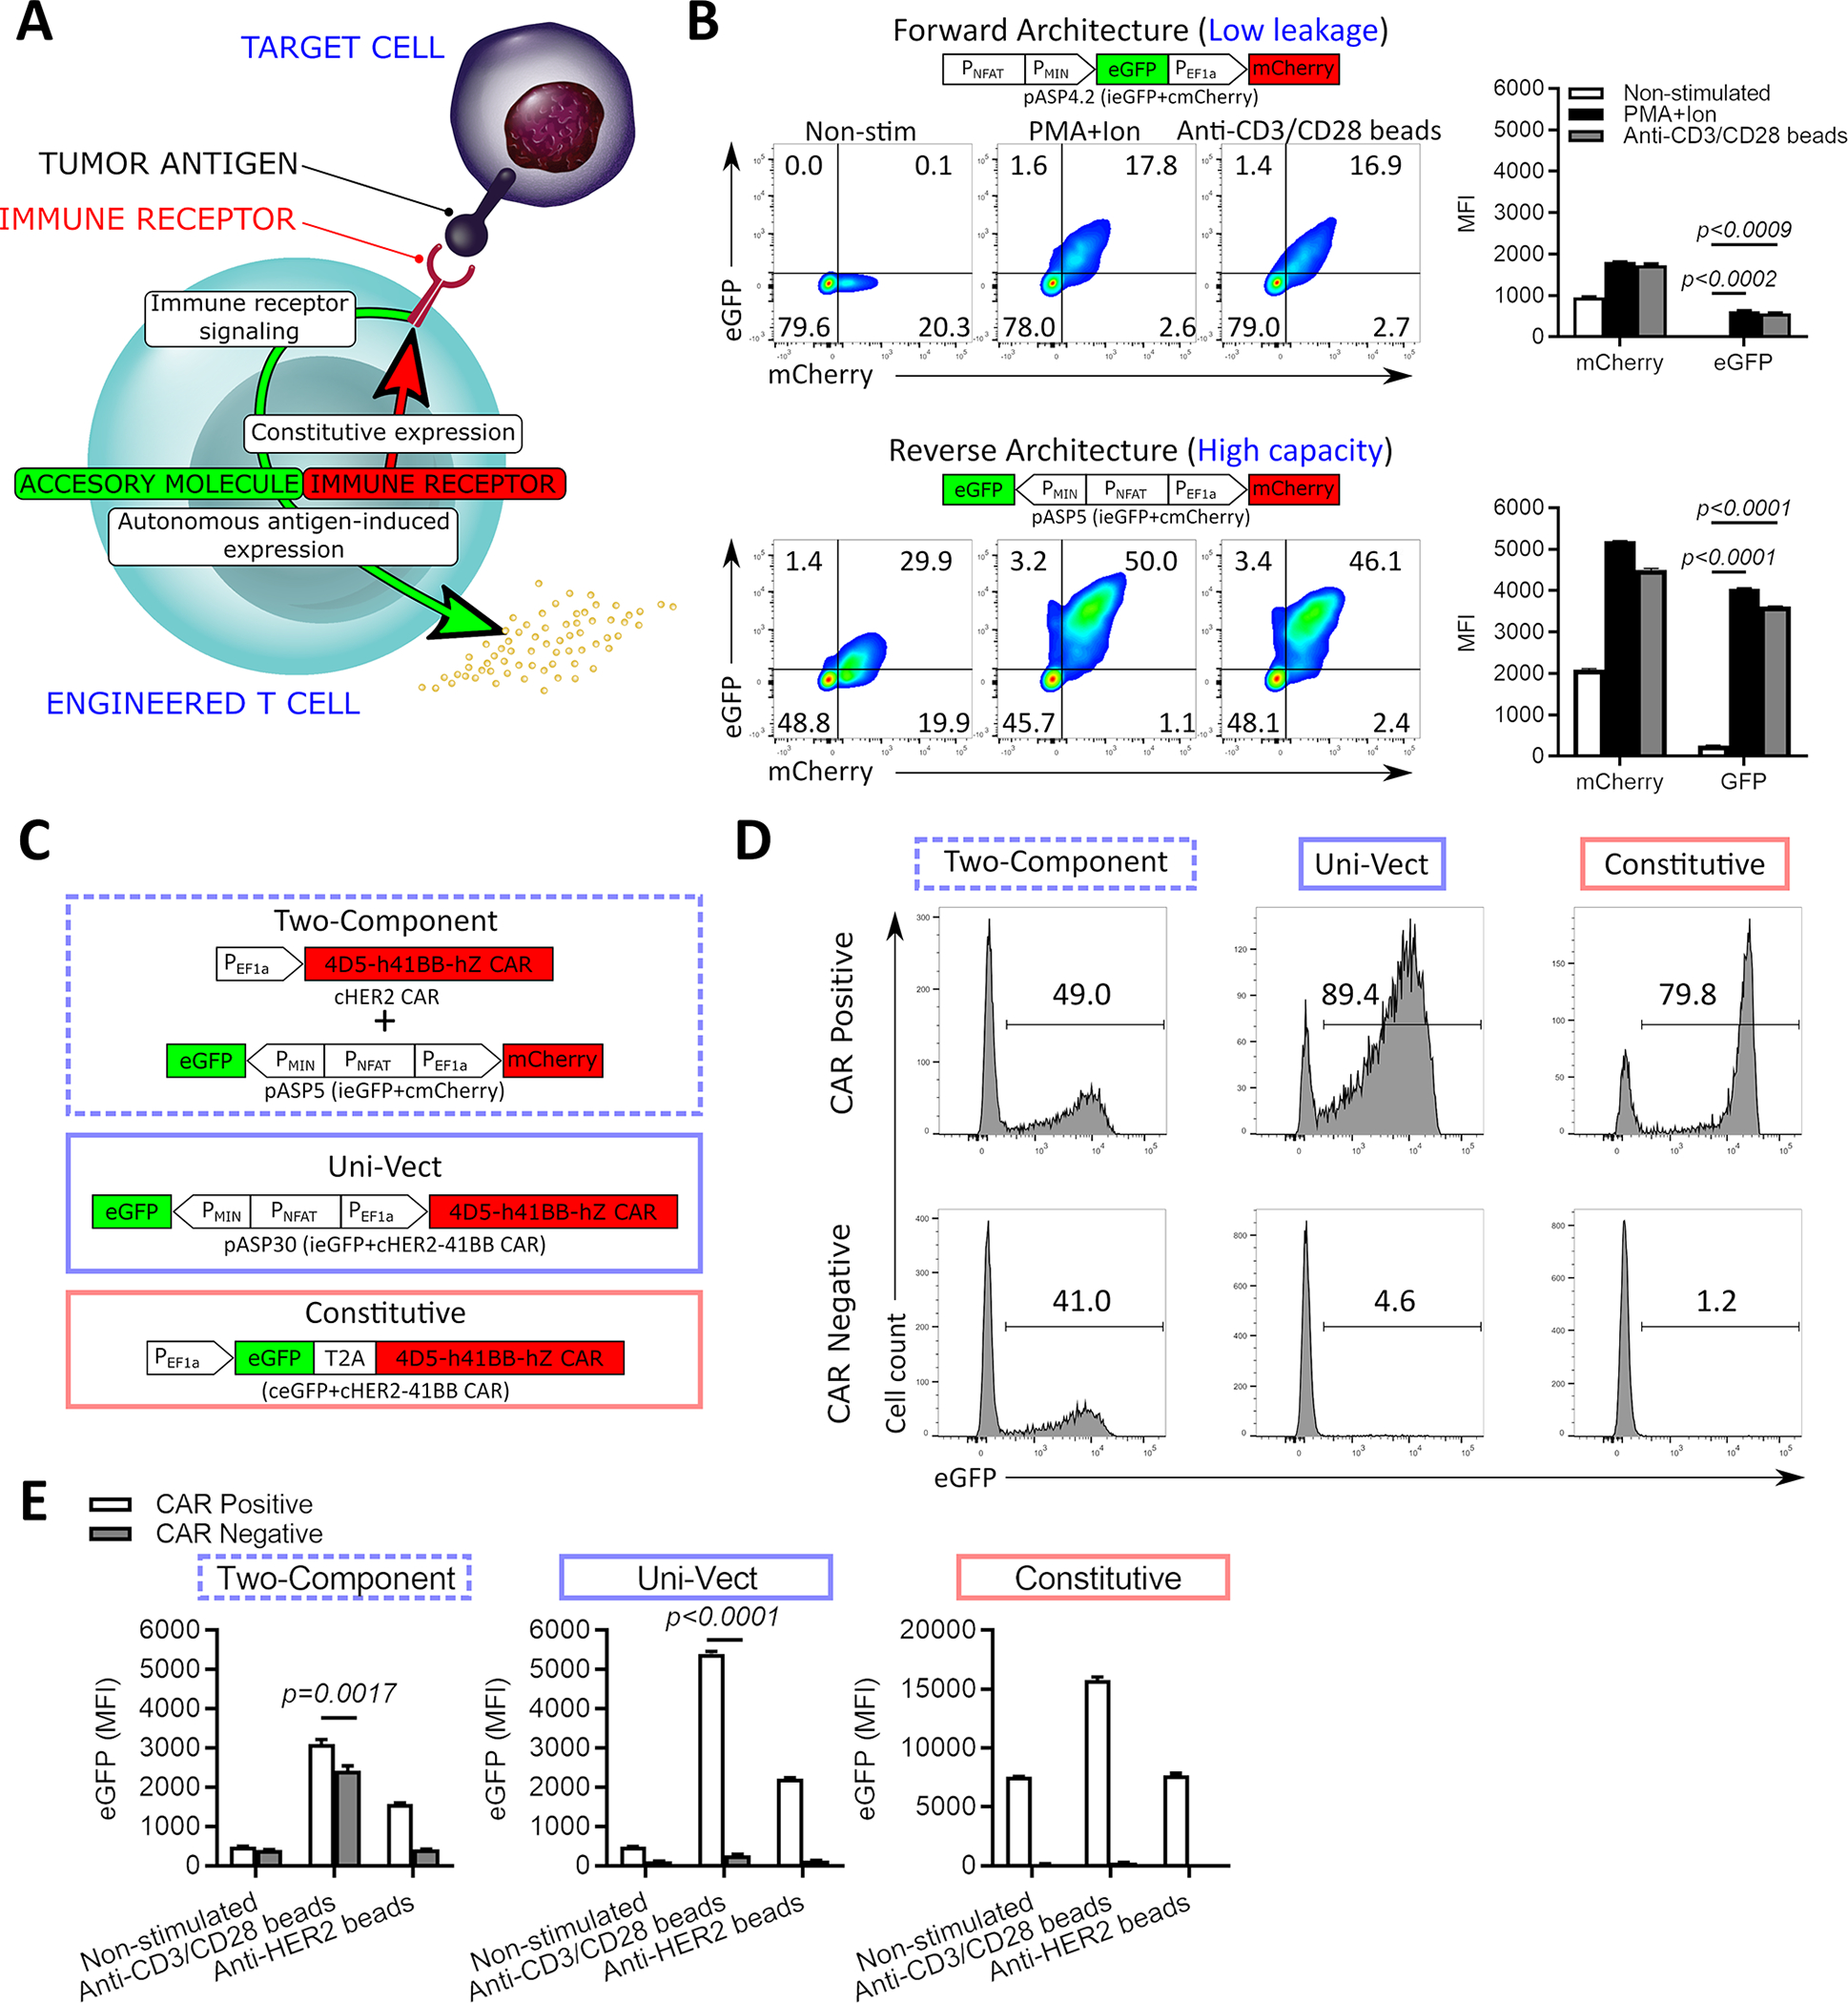
Figure 1: Design and Validation of Uni-Vect in Primary Human T Cells.

(A) Schematic representation of Uni-Vect recognizing a target antigen. (B) Primary human T cells were transduced with pASP4.2 or pASP5 at MOI5 and stimulated. Expression of reporter genes was monitored and quantified as MFI after 24 h. (n=3). (Welch ANOVA) (C) Schematic representation of compared constructs/experimental groups. (D-E) Primary human T cells were transduced with the vectors shown in C. Cells were sorted into CAR+ and CAR− fractions then stimulated. (D) eGFP expression of cells activated with PMA+ionomycin overnight. Histograms are shown for CAR+ and CAR− fractions. (E) Cells were left unstimulated or stimulated through TCRs or CARs for 24 h. MFI of eGFP is shown. (n=3). (Student’s T test). MFI; Mean fluorescence intensity. NS; not significant. All data with error bars are presented as mean ± SD. All data are representative of two or more experiments. See also Figures S1 and S2 and Table S1.
