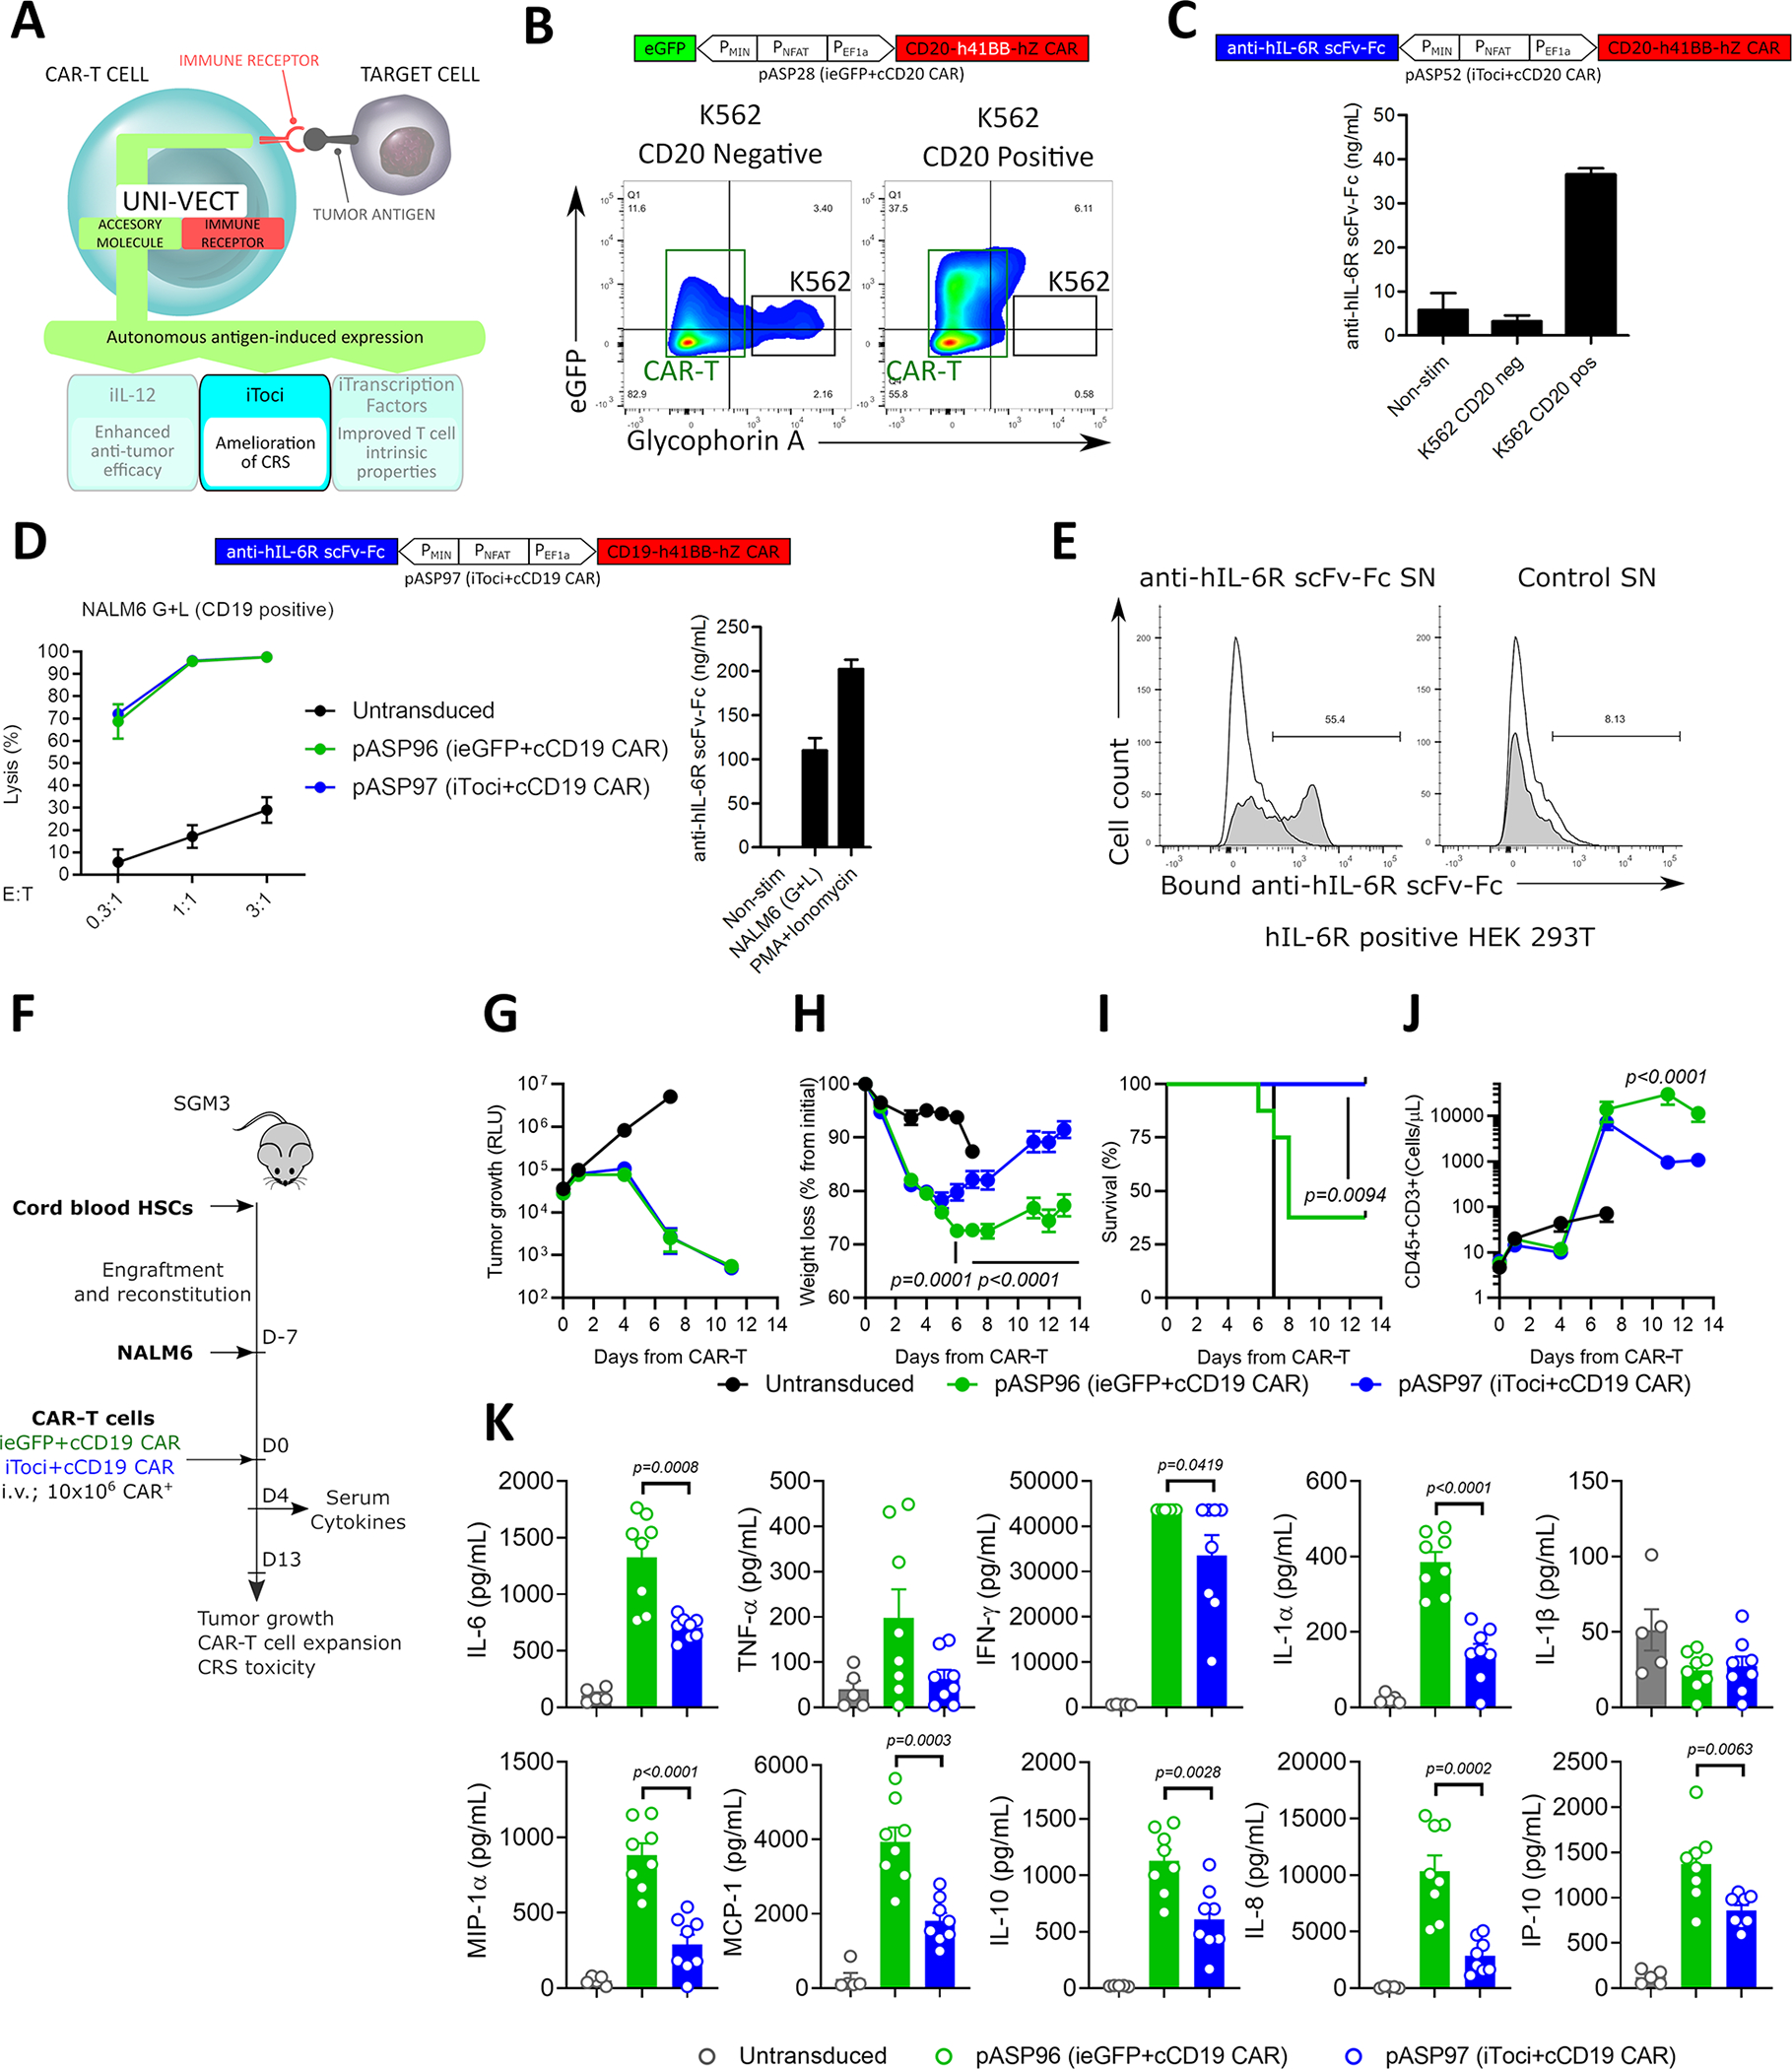
Figure 5: Antigen-inducible Secretion of Biologically Active Tocilizumab-based scFv-Fc from CAR-T cells.

(A) Schematics of iToci integrated into Uni-Vect. (B) pASP28-CAR-T cells were co-cultured with CD20+ or CD20− K562 cells at 5:1 effector to target ratio for 24 h. Flow graph represents inducible eGFP, concomitant with target cell lysis. K562 cell lines (black rectangle) were stained for Glycophorin A expression and appear as Glycophorin+eGFP− population. CAR-T cells appear in Glycophorin− population (green rectangle). (C) pASP52-CAR-T cells were co-cultured with CD20+ or CD20− K562 cells at 3:1 effector to target ratio for 72 h. Antigen-dependent secretion of iToci was measured. (n=3) (D) pASP97-CAR-T cells or control pASP96-CAR-T cells were co-cultured with CD19+ NALM6 cell line for 48 h. Lysis was measured by luciferase assay (Left) and concomitant secretion of iToci was measured by ELISA (Right). (n=3) (E) pASP52-CAR-T cells or control pASP28-CAR-T cells were co-cultured with CD20+ cell line. Supernatants from these co-cultures were added to the HEK 293T cells engineered to express hIL-6Rα and binding of iToci was examined. (F) In vivo study design. pASP97-CAR-T cells or control pASP96-CAR-T cells were injected in humanized SGM3 mice engrafted with CD19+ NALM6 cell line. (n = 8 mice per group for iToci+cCD19 CAR and ieGFP+cCD19 CAR; n = 5 for untransduced group) Experiment was performed once. We monitored (G) tumor growth control, (H) weight loss (Two-Way ANOVA), (I) survival of mice (Log-rank Mantel-Cox test) and (J) hCD45+CD3+ T cell numbers in peripheral blood (Two-Way ANOVA). (K) Inflammatory cytokines were measured in serum 4 days after CAR-T cells injection (Two-Way ANOVA). SN, supernatant. NS; not significant. Error bars are presented as mean ± SD in C and D and as mean ± SEM in G, H, J and K. See also Figure S6 and Table S1.
