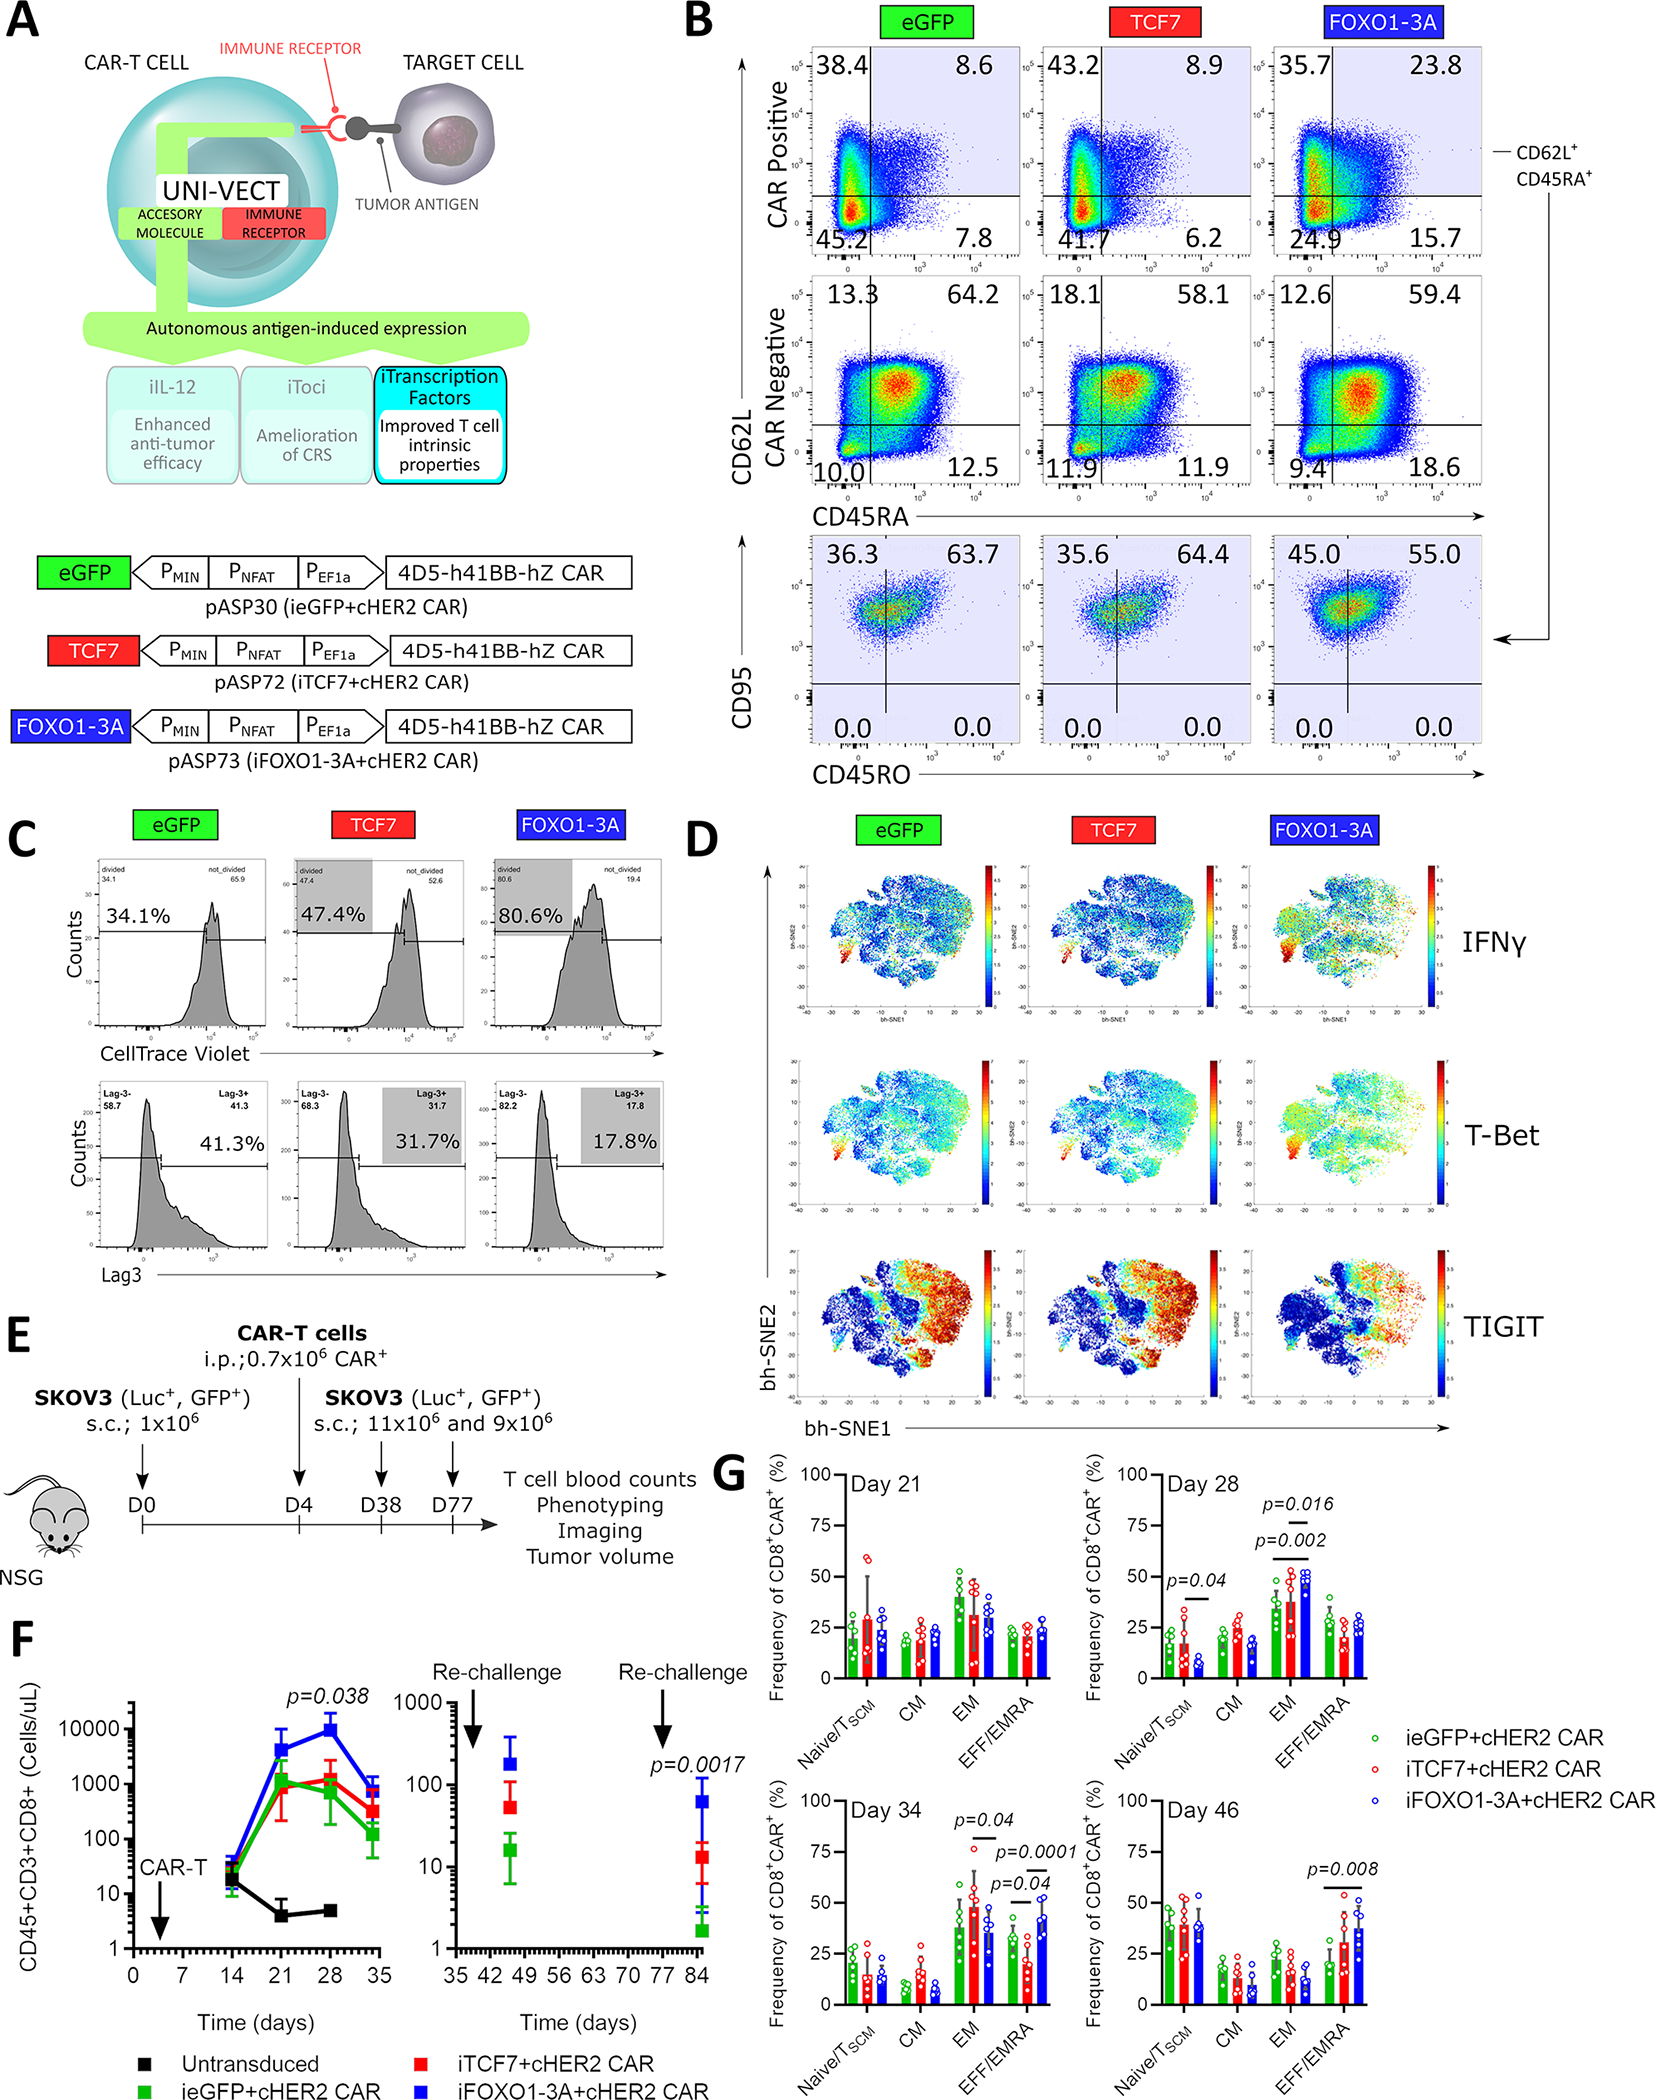
Figure 6: Inducible Transcription Factors Program Therapeutically Relevant CAR-T Cell States and Improve Expansion In Vivo.

(A) Schematics of iTFs integrated into Uni-Vect; pASP30, pASP72, and pASP73 Uni-Vect constructs. (B) iTF-CAR-T cells were exposed to SKOV3 cells twice (Detailed in Figure S7A). Phenotype was analyzed 3 days after second stimulation. Data is representative of 2 experiments performed. (C) iTF-CAR-T cells were sorted for CAR+ population and exposed to repeated stimulations with SKOV3 cells (Detailed in Figure S7A). Upper: After 2nd stimulation, iTF-CAR-T cells were labeled with CellTrace Violet and re-exposed to SKOV3 cells for 5 days. Proliferation was measured. Lower: Lag3 expression after 3rd stimulation. (D) 3 days after 4th round of stimulation described in (C), T cell phenotype markers were analyzed by CyTOF. (E) In vivo study design. n = 7 mice per experimental group. After initial tumor clearance, mice were re-challenged twice with SKOV3. (F) CD8+ T cell counts in peripheral blood. Left: initial response and Right: after re-challenges. (Kruskal-Wallis test) (G) Memory phenotype of CAR+ T cells from peripheral blood. For F and G, all data with error bars are presented as mean ± SD. (Two-way ANOVA). In vitro data are representative of three experiments. Data from in vivo study are representative of two experiments performed with two independent iTF-CAR-T cell products. See also Figure S7 and Table S1.
