
Fig. 2. HSC depletion decreases liver mass and diminishes midlobular hepatocyte numbers.
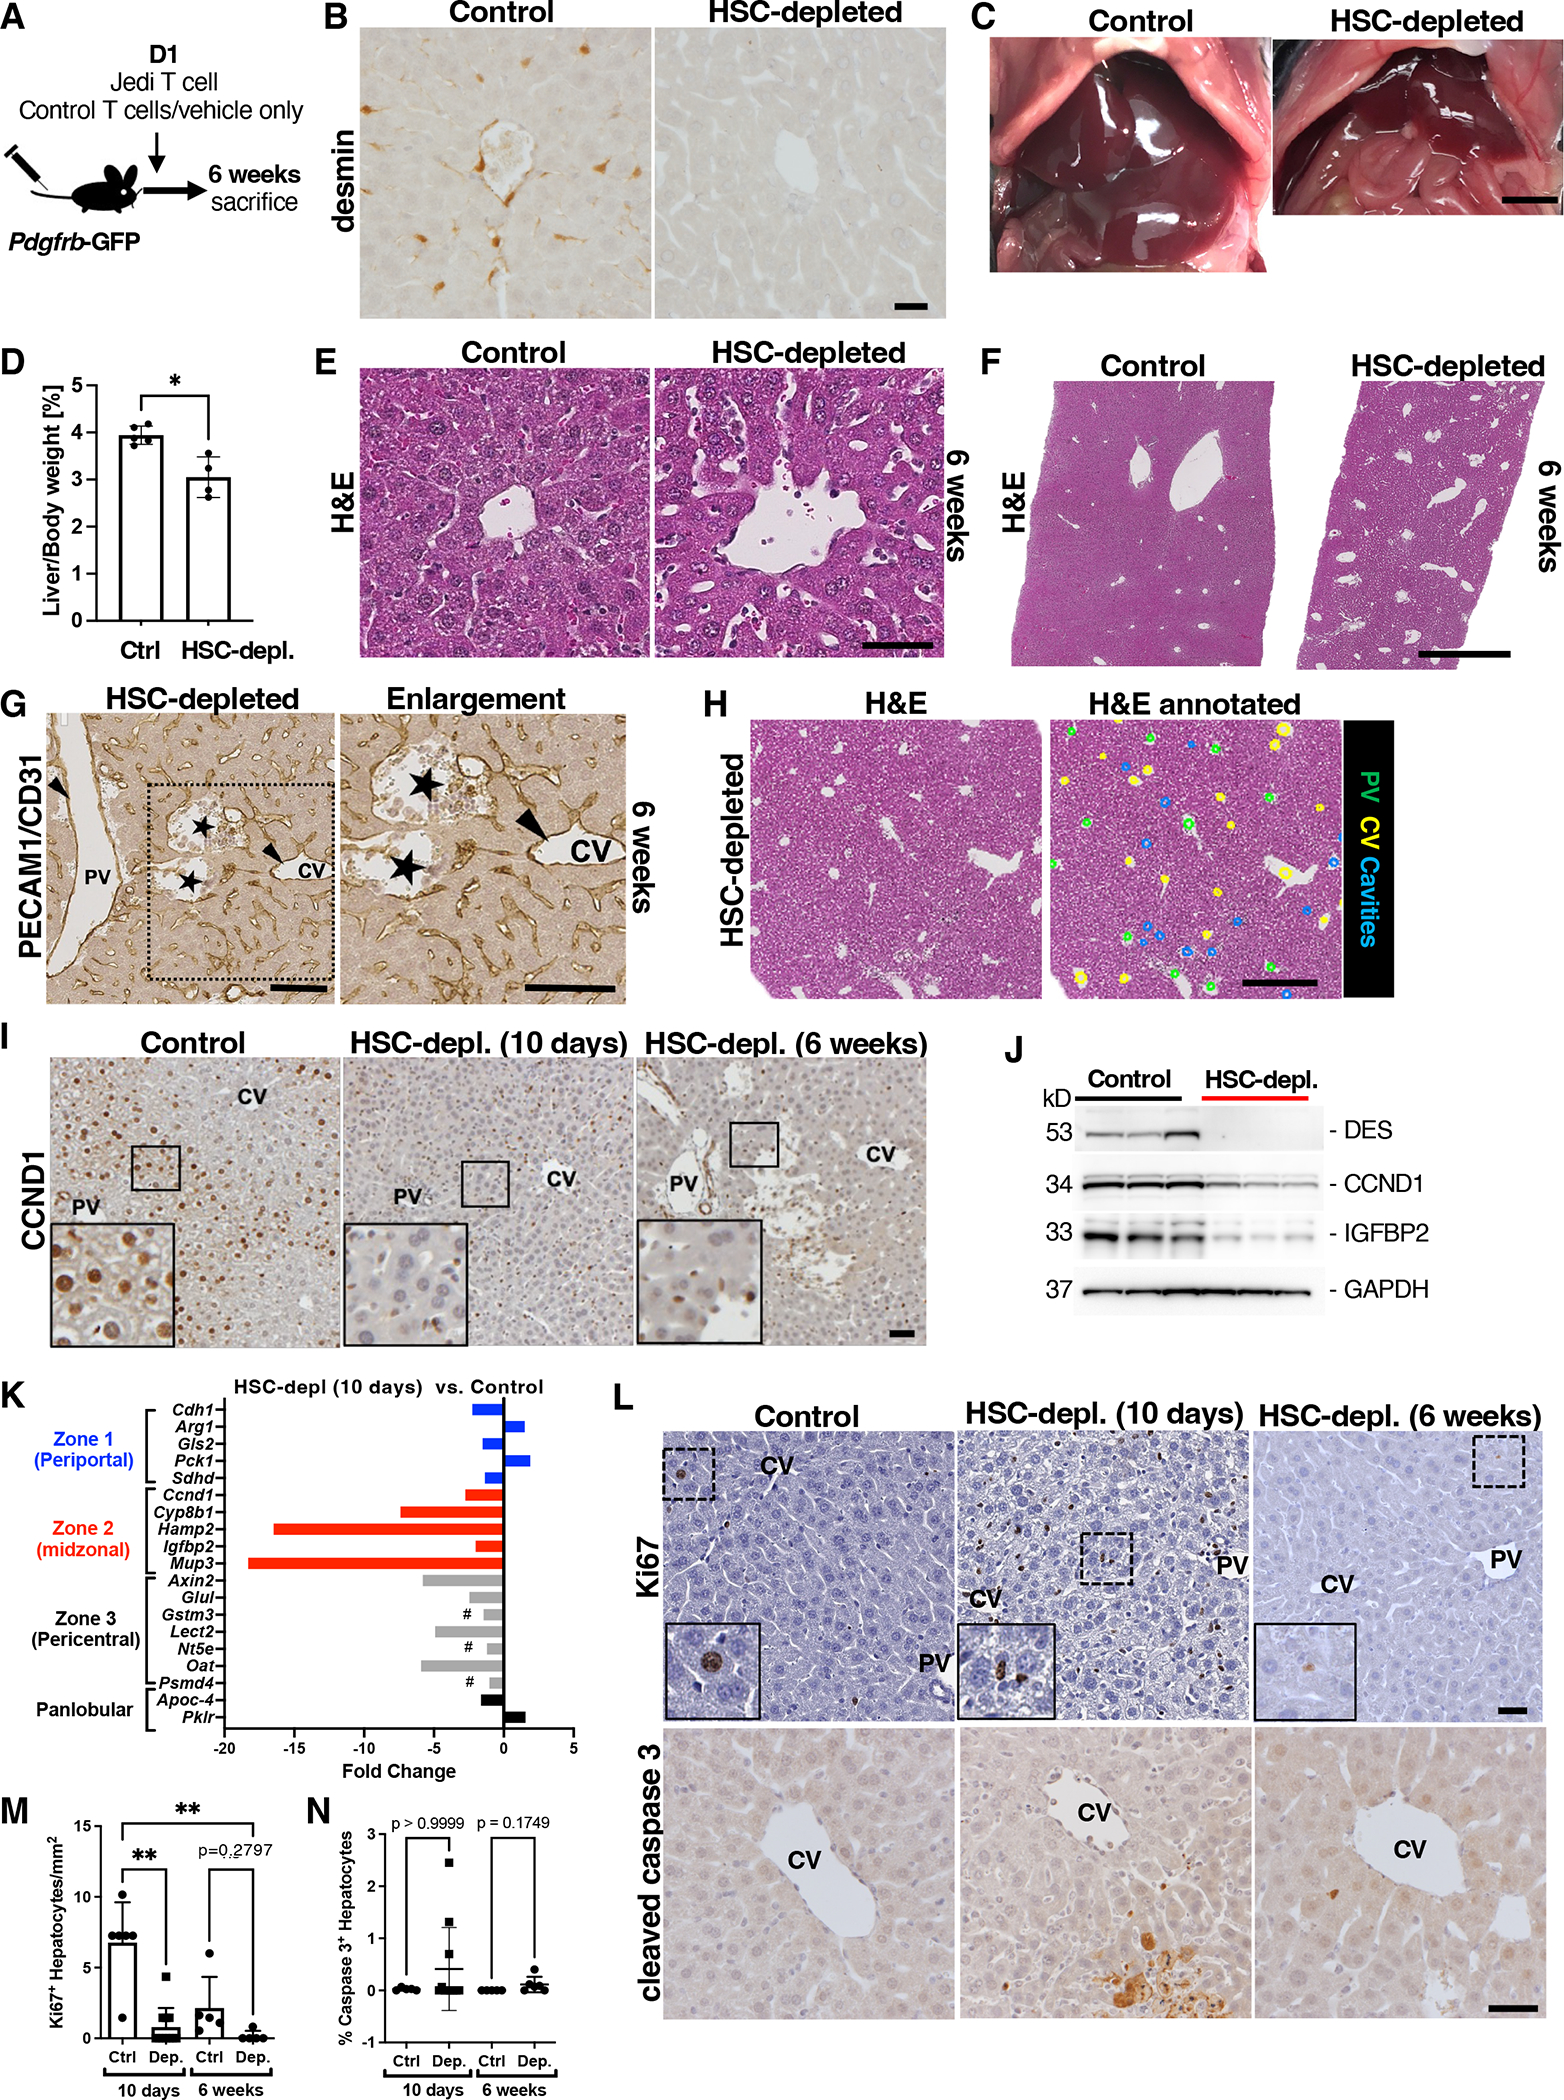
(A) Experimental scheme. (B) Immunohistochemical staining for desmin in control and HSC-depleted mice 6 weeks after adoptive transfer. Scale bar, 20 μm. n = 5. (C) Macroscopic images of control and HSC-depleted mouse livers in situ. Scale bar, 5 mm. (D) Liver-to-body weight ratios of control and HSC-depleted mice at 6 weeks. N=5 control and 4 HSC-depleted animals. *p<0.05 by unpaired two-tailed Mann-Whitney test. (E and F) High- and low-magnification of H&E staining of control and HSC-depleted livers 6 weeks after adoptive transfer. Scale bars, 50 μm (E) and 1 mm (F). n = 5 control and 5 HSC-depleted mice. (G) Immunohistochemical staining for CD31 in an HSC-depleted liver section. Arrows indicate endothelial lining of vessels. PV, portal vein; CV central vein. Stars indicate acellular cavities with absent endothelium. Square indicates area of enlargement. Scale bars, 100 μm. Image is representative of 5 mice. (H) H&E staining of HSC-depleted liver section at 6 weeks. In the annotated image, green dots indicate portal vein (PV), yellow dots central vein (CV), and blue dots acellular cavities. Scale bar, 500 μm. n = 5. (I) Immunohistochemical staining for CCND1 in control and HSC-depleted livers at 10 days and 6 weeks after adoptive transfer. Squares indicate areas of enlargement in inserts. Scale bar, 50 μm. n = 6 control and 11 HSC-depleted mice at 10 days after adoptive transfer. n=5 control and n=5 HSC-depleted mice 6 weeks after adoptive transfer. (J) Western blot showing desmin, CCND1, and IGFBP2 in whole-liver lysates from control and HSC-depleted livers 10 days after adoptive transfer. Gapdh is a loading control. Each lane represents 1 mouse. n = 3 control and 3 HSC-depleted mice. (K) Whole-liver RNA-seq analysis of control and HSC-depleted livers 10 days after adoptive transfer. n=6 controls and 4 HSC-depleted mice. #, non-differentially expressed genes (FDR>0.34). (L) Immunohistochemical staining and quantification of Ki67 and cleaved caspase 3 in control and HSC-depleted livers at 10 days and 6 weeks after adoptive transfer. Scale bar, 30 μm. Dashed rectangles indicate areas of enlargement in inserts. PV, portal vein. CV, central vein. Ki67+ hepatocytes per mm2 in control and HSC-depleted livers at 10 days and 6 weeks after adoptive transfer. n=6 control and 11 HSC-depleted animals at 10 days after adoptive transfer. n = 5 control and 5 HSC-depleted animals at 6 weeks after adoptive transfer. Mean+SD. Kruskal-Wallis with post hoc Dunn’s test. **p<0.005.