
Fig. 3. NTF3 is an HSC-derived hepatocyte mitogen that increases CCND1.
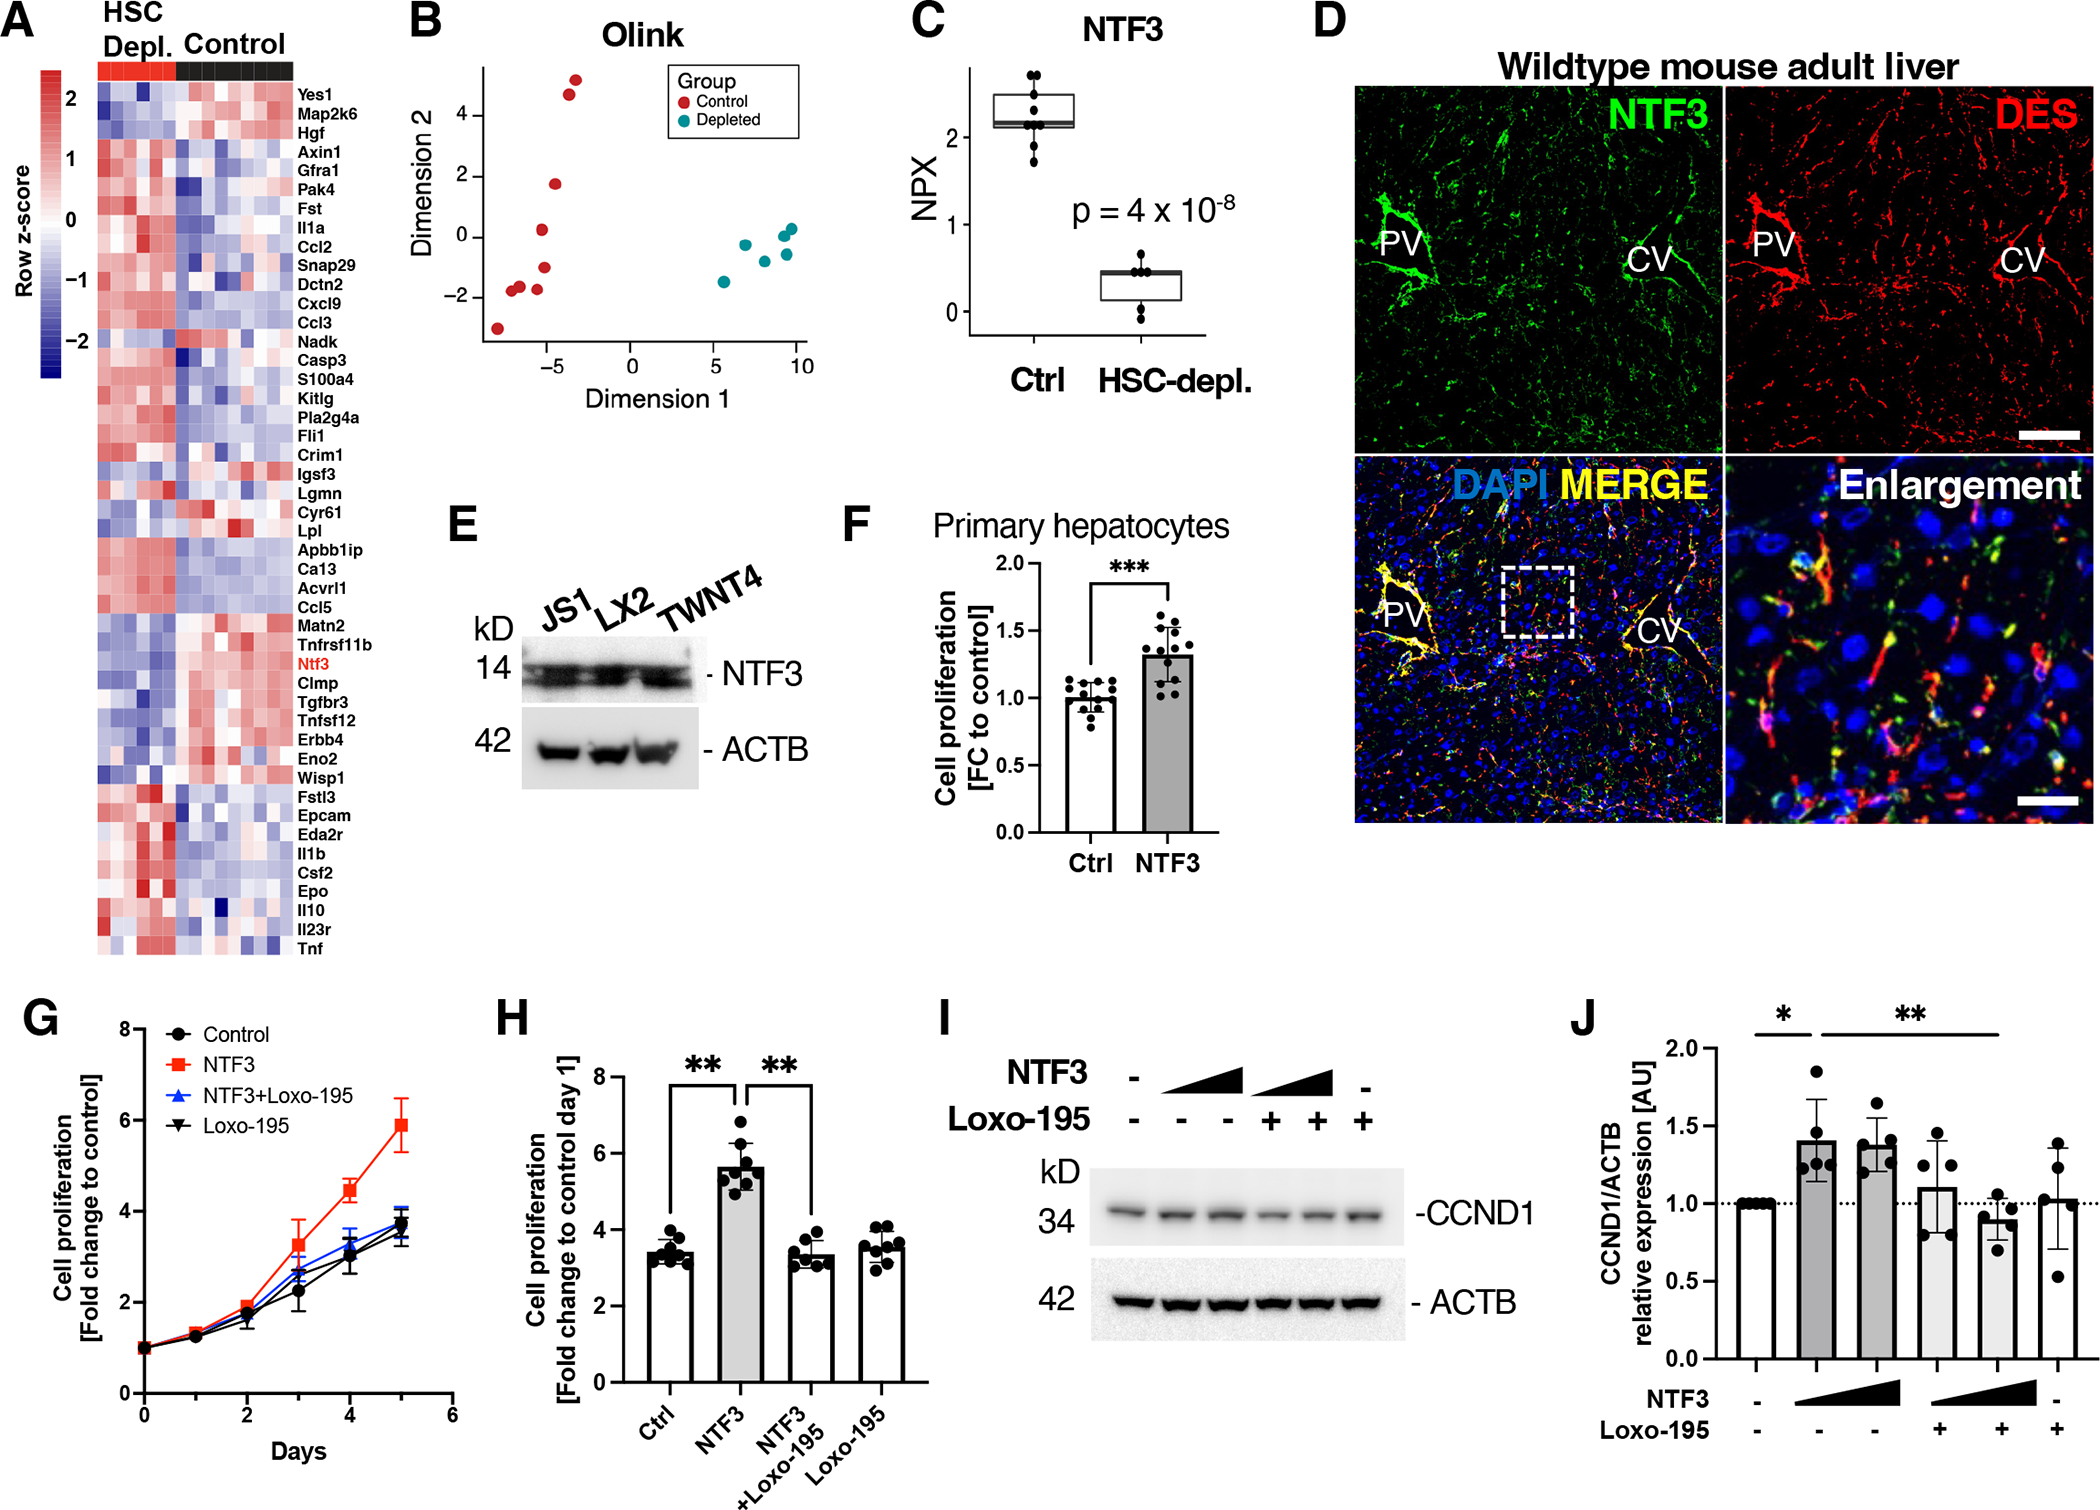
(A to C) Olink protein biomarker analysis (A), multidimensional scaling of Olink biomarker analysis (B), and quantification of NTF3 (C) in lysates from control and HSC-depleted livers 10 days after adoptive transfer. NPX, normalized protein expression. n=9 control and 6 HSC-depleted mice. (D) Immunofluorescence microscopy for NTF3 and desmin in wild-type adult mouse liver. Nuclei are stained with DAPI. Dashed rectangle indicates area of enlargement. Scale bar, 100 μm and 20 μm in enlargement. PV, portal vein. CV central vein. n = 5 mice. (E) Western blot of mouse and human HSC cell lines for NTF3. ACTB is a loading control. n = 3 independent experiments per cell line. (F) Proliferation of primary wild-type mouse hepatocytes after incubation with NTF3 (20 ng/ml) or vehicle in serum-free media for 5 days. Data from 3 independent experiments. Mean+SD. ***p=0.0002 by unpaired two-tailed Mann-Whitney test. (G) Cell proliferation analysis of HepG2 cells incubated with NTF3, NTF3+Loxo-195, Loxo-195, or vehicle only (control). n = 3 independent experiments. Mean+SD. (H) Proliferation of HepG2 cells treated with NTF3, NTF3+Loxo-195, Loxo-195, or vehicle only for 5 days. n = 3 independent experiments. Mean+SD. **p<0.005 by unpaired two-tailed Mann-Whitney test. (I and J) Western blot analysis and quantification of CCND1 in lysates from HepG2 cells treated with NTF3 and Loxo-195 as indicated or vehicle only. ACTB is a loading control. n = 5 independent experiments. Mean+SD. Kruskal Wallis with post hoc Dunn’s test. *p<0.05, **p<0.01.