
Figure 5: TimeLapse-seq enables profiling of differential gene expression kinetics upon DcpS degradation and inhibition.
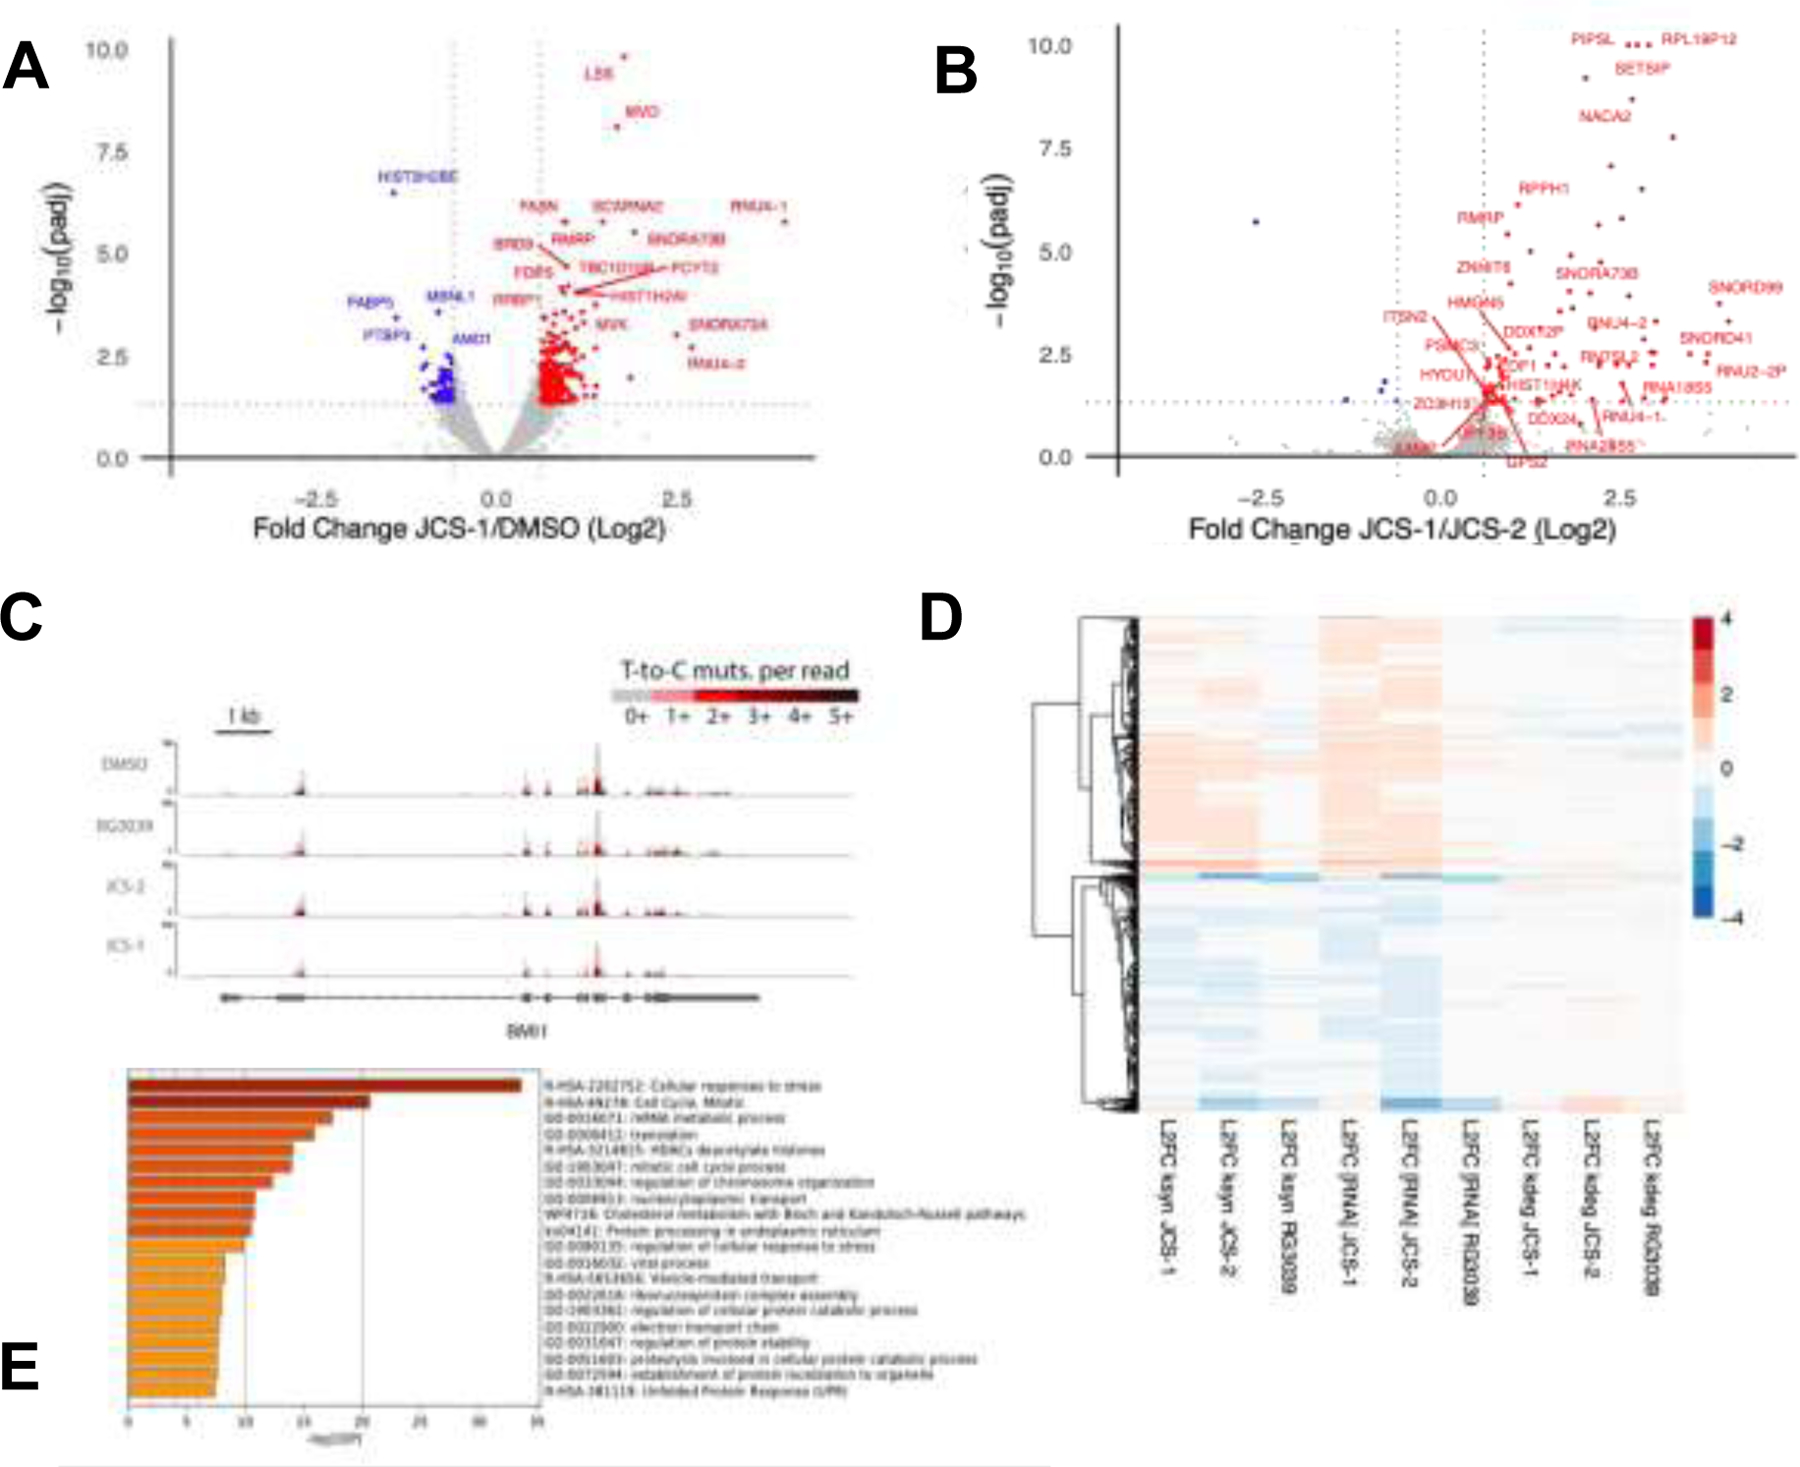
(A) Volcano plot describing log2 fold changes in total RNA in MOLM-14 cells treated with JCS-1 (1 μM, 6 hr) versus DMSO. Points in red represent transcripts upregulated in JCS-1 treated samples with padj < 0.05 and log2 fold change > 0.6. Points in blue represent transcripts downregulated in JCS-1 treated samples with padj < 0.05 and log2 fold change < −0.6. All log2 fold change and padj values were calculated according to DESeq2. Data points represent two biological replicates. Additional data point labels are assigned in SI Excel Sheet 1. (B) Volcano plot describing log2 fold changes in total RNA in MOLM-14 cells treated with JCS-1 (1 μM, 6 hr) versus JCS-2 (1 μM, 6 hr). Red and blue colored points represent differentially expressed genes across treatments with padj < 0.05 and |log2 fold change| > 0.6. Transcripts that were not significantly differentially expressed in JCS-1 treated samples relative to DMSO treated samples (see Fig. 5.A) were excluded from labeling. Data points represent two biological replicates. (C) TimeLapse-seq tracks of BMI1 in MOLM-14 cells treated with DMSO, RG3039, JCS-2, or JCS-1. BMI1, an AML implicated proto-oncogene, was identified as significantly downregulated in JCS-1 treatments. Increased T-to-C mutational content indicates higher s4U incorporation corresponding to newly synthesized RNA. (D) TimeLapse-seq profiling estimates decay- and synthesis-driven changes in total RNA. The heat map shown describes the log2 fold differences in total RNA and ksyn and kdeg rates for transcripts in JCS-1, JCS-2, and RG3039 treated samples relative to DMSO treated controls. Rows represent 8275 selected genes that exhibited significant differential expression (padj < 0.05) in either of the JCS-1, JCS-2, or RG3039 treatments relative to DMSO. Color of the displayed rows indicate the sign and magnitude of log2 fold change. Transcripts with similar expression patterns were clustered together in the dendrogram on the left. (E) Metascape gene enrichment analysis of MOLM-14 cells treated with JCS-1 (1 μM, 6 hr). Gene signatures were identified by filtering for differentially expressed transcripts with padj < 0.10.