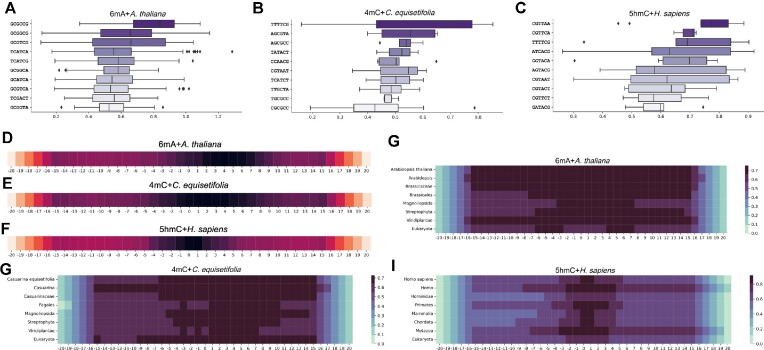
Figure 3:
Interpretation of MuLan-Methyl by attention weights resulting from transformer self-attention mechanism. (A–C) Boxplots show the distribution of attention weights for the ten 6-mer of highest average importance scores, for the combinations 6mA + A. thaliana, 5mC + C. equisetifolia and 5hmC + H. sapiens, respectively. (D–F) We indicate the importance score for each position in the DNA sequences of length 41, obtained by merging 6-mer fragments, for the same 3 combinations listed above, respectively. (G–I) For each taxonomic rank of a lineage, we indicate the attention weight assigned by MuLan-Methyl to each position of the sequence for generating the taxon of the given rank, for the same 3 combinations listed above, respectively.

