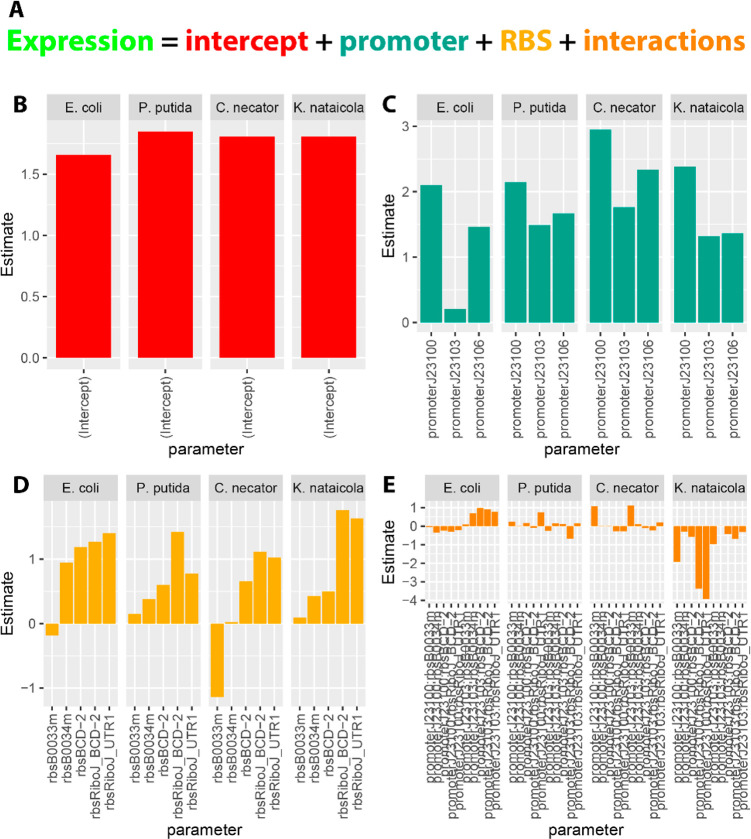
Figure 5.
Linear models for part performance across species. (A) General form of the linear models. Expression is the sum of an intercept term plus estimates computed for each promoter, RBS, and the interactions between them. Due to high correlation between variables (i.e., very similar expression between parts), some parameters were not estimated (see Methods). (B) Bar chart of the intercept values, interpreted as background fluorescence, were similar between species. (C) Bar chart of the promoter coefficients. The contribution of each promoter to expression had conserved rank order in each species, however the magnitudes varied. Notably, the expected very low expression of the J23103 promoter in E. coli was not conserved. (D) Bar chart of the RBS coefficients. Rank order of the RBS coefficients is not conserved between species. (E) Bar chart of the interaction terms between promoters and RBSs. Interactions between promoter and RBS terms were very high in K. nataicola relative to other species, especially for those terms including the J23100 promoter.

