Figure 2.
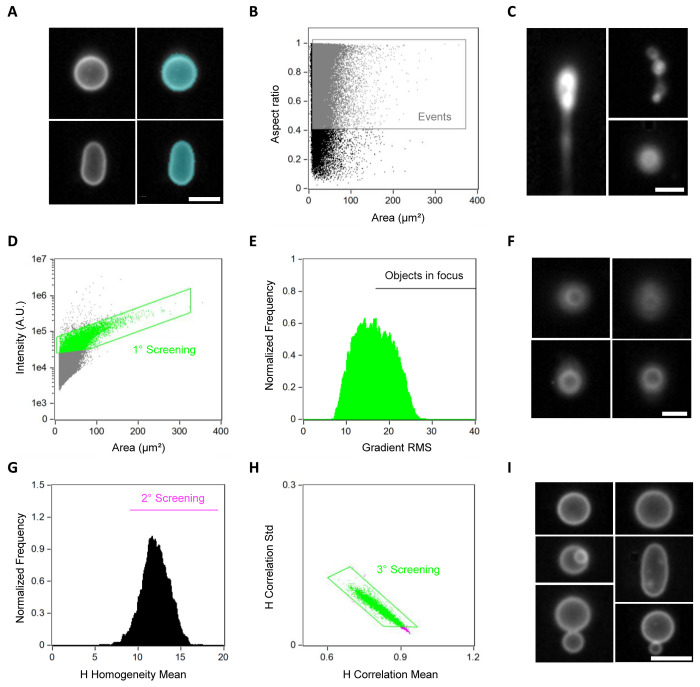
Sequential gating pipeline for identification of liposomes. (A) Images of two liposomes (left) acquired with ImageStream and their respective mask (right). The mask specifies the area to be used during the analysis and it was customized to select for the whole liposome. (B) Data plot showing the area and aspect ratio features of collected events. Objects having a surface area higher than 8 μm2 and an aspect ratio higher than 0.4 were gated as relevant events (in gray). (C) Images of some aggregates with different sizes and shapes that were filtered out by the gating step in (B). (D) Comparison of the intensity of the membrane signal vs the area of the mask. Selected data points are gated in green. (E) Out-of-focus events were discarded based on the gradient RMS feature. Events with a gradient RMS higher than 18 were selected for further analysis. (F) Examples of images showing out-of-focus liposomes that were discarded from the analysis. (G) Second gating step aiming at selecting objects with high H-homogeneity values (in magenta). (H) Final selection criterion based on the analysis of the H-correlation mean and standard deviation functions. The selected objects (gated in green) correspond to the final library of liposomes, which is clean from undesired objects. (I) Small gallery of liposome images that passed the gating pipeline. For all the images, the white color represents the membrane dye signal. Scale bars are 7 μm.

