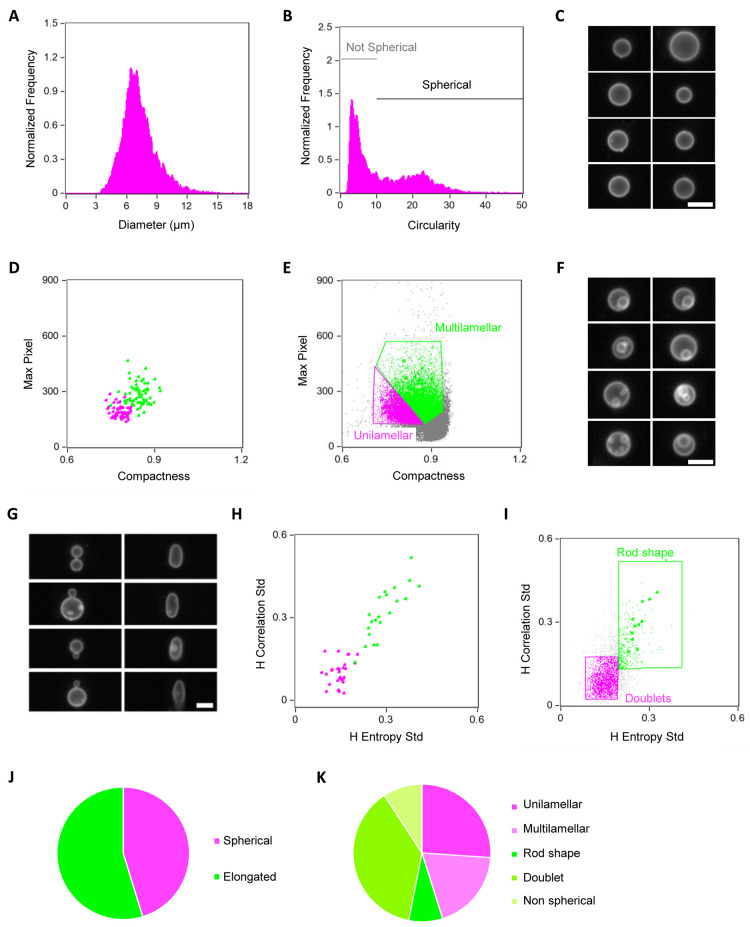
Figure 3.
Characterization of liposome morphology. (A) Distribution of liposome diameter. (B) Shape analysis using the circularity feature. Objects with a high circularity value were gated as spherical liposomes. (C) Image gallery of some liposomes classified as spherical. (D) Two-dimensional plot of the compactness and max pixel features as output from the feature finder wizard tool performed to distinguish liposomes having intravesicular membrane structures. (E) Population analysis (compactness vs max pixel) applied to the spherical liposomes. Multilamellar/multivesicular and unilamellar liposomes are gated in green and magenta, respectively. (F) Image gallery of representative liposomes classified as multilamellar/multivesicular. (G) Image gallery displaying two different phenotypes present in the subpopulation of nonspherical liposomes gated in (B): doublets which correspond to two liposomes attached together (left) and rod-shape liposomes (right). (H) Two-dimensional plot of the H entropy std and H correlation std features as the outcome of the feature finder wizard tool analysis for discriminating between the two subpopulations of nonspherical liposomes shown in (G). (I) Population analysis (H entropy std vs H correlation std) applied to the nonspherical liposomes. Rod-shaped and doublet liposomes are gated in green and magenta, respectively. (J, K) Graphical representations of the statistics obtained from the morphometric analysis carried out on a set of over 70,000 liposomes from one sample. Nonspherical liposomes that did not belong to the categories “rod shape” or “doublet” were classified as “nonspherical”. For all the images, the white color represents the membrane dye signal. Scale bars are 7 μm.

