Figure 4.
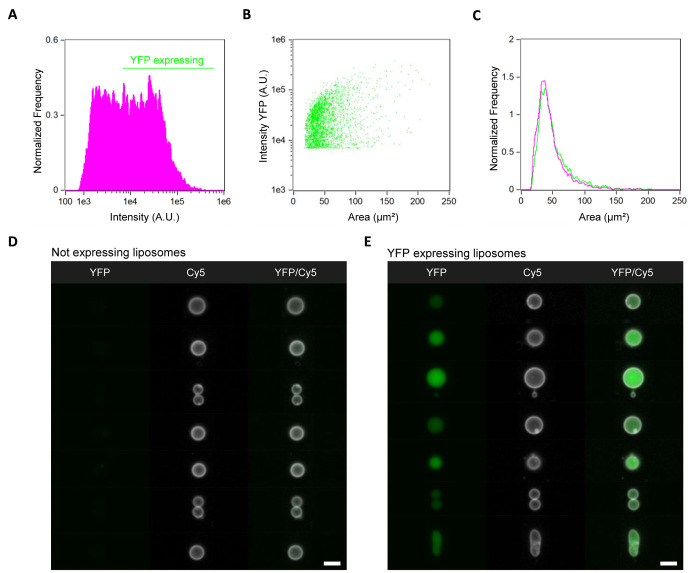
IFC data analysis of the transcription–translation module. (A) Histogram of the internal YFP intensity and definition of a threshold to distinguish nonexpressing from gene expressing liposomes. (B) Scatter plot of the liposomes area vs the intensity of expressed YFP. (C) Comparison of the size distribution between YFP-expressing liposomes (green) and nonexpressing liposomes (magenta). (D, E) Gallery of representative images of nonexpressing liposomes (D) and YFP-expressing liposomes (E). Membrane dye (Cy5) signal is colored in white, YFP is in green. The analysis was performed on a set of over 70,000 liposomes from one sample. Scale bars are 7 μm.

