Figure 5.
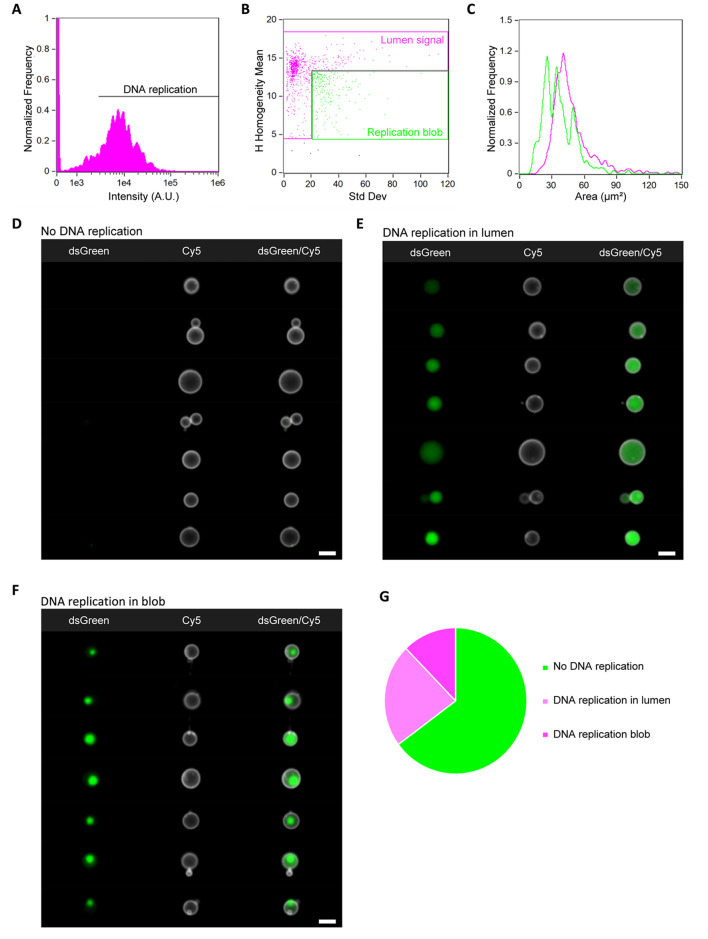
IFC data analysis of the DNA replication module. (A) Histogram of the intensity of the DNA-binding dye dsGreen in liposomes. Successful DNA replication is reflected by high intensity values. (B) Scatter diagram of the H-homogeneity mean vs std dev features to classify images with respect to the distribution of dsGreen fluorescence in the vesicle lumen. Liposomes with homogeneously distributed dsGreen are gated in magenta, while vesicles exhibiting a “replication blob” are gated in green. (C) Histograms of liposome size (area) for the two subpopulations defined in (B). Color coding is the same as in (B). Liposomes with a replication blob are on average smaller than those with an even intraluminal signal. (D–F) Gallery of representative images of liposomes with no DNA replication (D), increased DNA amount with homogeneous spatial localization (E), and increased DNA amount with formation of condensates (F). (G) Graphical representation of the statistics obtained from the analysis of over 60,000 liposomes from one sample. For all the images, the membrane dye (Cy5) signal is colored in white and DNA-bound dsGreen is in green. Scale bars are 7 μm.

