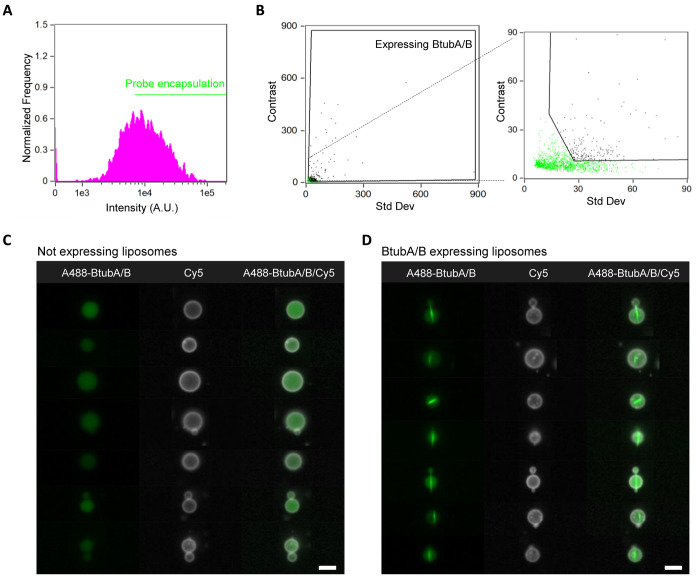
Figure 6.
IFC data analysis of the bacterial microtubule module. (A) Histogram of the intensity of encapsulated A488-BtubA/B. Liposomes with an above-threshold intensity value were selected. (B) Liposomes with cytoskeletal structures were identified by plotting the std dev vs the contrast feature (black gate). A zoom-in image is shown on the side to better visualize the two populations and the applied gating. (C, D) Gallery of representative images of liposomes with encapsulated free tubulin but no filaments (C) or with characteristic microtubules of expressed BtubA/B (D). For all the images, the membrane dye (Cy5) signal is colored in white and A488-BtubA/B is in green. The analysis was performed on a set of over 35,000 liposomes from one sample. Scale bars are 7 μm.

