Figure 7.
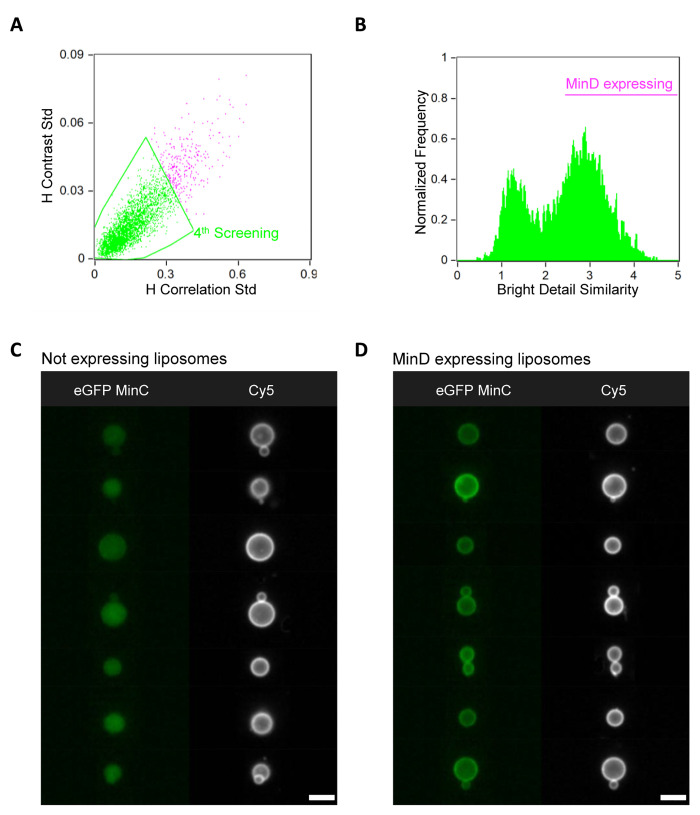
IFC data analysis of the Min self-organization module. (A) Scatter diagram of the parameters H-correlation std and H-contrast std used as an additional image processing step for the identification of higher quality liposomes. The membrane dye (Cy5) signal was used for the analysis. Gated events considered as good liposomes are colored in green. (B) Histogram of the bright detail similarity R3 feature (using as inputs the two images in the Cy5 and eGFP-MinC channels) from the liposomes gated in (A). Gated liposomes with active Min proteins exhibit membrane localization of the eGFP-MinC signal upon binding to expressed MinD. (C, D) Gallery of representative images of liposomes with an inactive (lumen localization of eGFP-MinC, panel C) or active (membrane localization of eGFP-MinC, panel D) MinD-MinC system. For all the images, the membrane dye (Cy5) signal is colored in white and eGFP-MinC is in green. The analysis was performed on a set of 40,000 liposomes from one sample. Scale bars are 7 μm.

